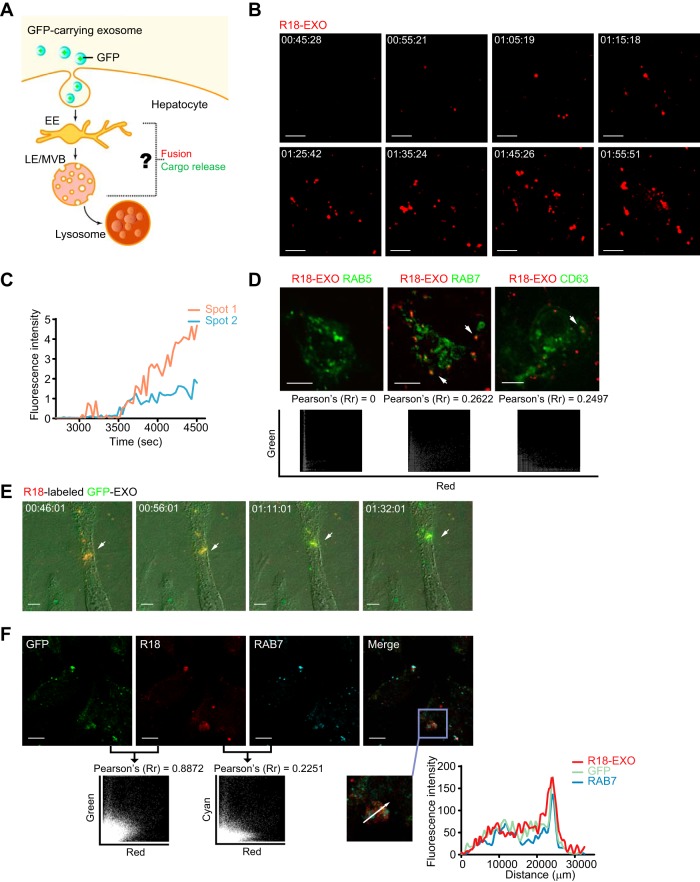
FIG 5.
Membrane fusion of GFP-carrying exosomes occurs in LEs/MVBs. (A) Hypothetical model of exosome fusion and cargo release in endosomes. (B) Images of R18 dequenching triggered by exosome membrane fusion. R18-dequenching fusion spots (red) were tracked and imaged at the indicated time points via time-lapse microscopy. Scale bars: 5 µm. (C) Time-intensity profiles of R18 fluorescence of two representative dequenching spots in panel B. (D) Membrane fusion signals of exosomes colocalized with the LE marker CFP-RAB7 and the ILV marker CFP-CD63. Dynamic colocalization events of dequenching signals (red) with cellular markers (CFP pseudocolored green) were tracked via time-lapse microscopy. Scatterplots and Pearson’s correlation coefficients for colocalization are presented below the images. Scale bars: 5 µm. (E) Color shift induced by ongoing fusion process of GFP-carrying exosomes prelabeled with self-quenching concentrations of R18 was observed and imaged via time-lapse microscopy. Scale bars: 5 µm. (F) Membrane fusion signals of GFP-carrying exosomes colocalized with the LE marker RAB7. Scatterplots and Pearson’s correlation coefficient between the signals of GFP and R18 or the signals of R18 and RAB7 are presented. Fluorescence intensity profiles of GFP, RAB7, and R18 along the indicated white arrow in the ROI are also presented. Scale bars: 10 µm.

