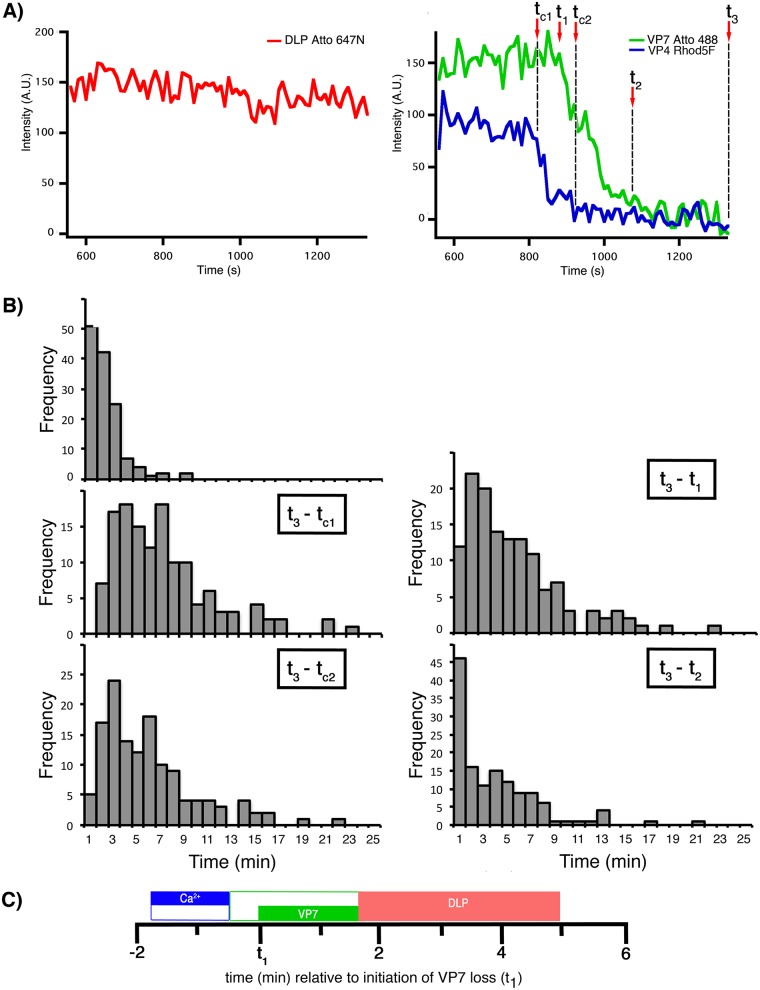
FIG 11.
Kinetics of VP7 and Ca2+ loss and DLP release from Rhod5F rcTLPs. (A) Traces for DLP (left) and for VP7 and VP4 Rhod5F (right). Dashed vertical lines show the onset and termination of VP7 loss (t1 and t2, respectively), the onset and termination of Ca2+ loss (tc1 and tc2, respectively), and DLP release (t3). (B) Distribution of intervals between the onset of VP7 and Ca2+ loss (t1 − tc1), the onset of Ca2+ loss and DLP release (t3 − tc1), the onset of VP7 loss and DLP release (t3 − t1), termination of Ca2+ loss and DLP release (t3 − tc2), and termination of VP7 loss and DLP release (t3 − t2), from 134 uncoating particles collected from 35 BSC-1 cells infected at an MOI of 10. (C) Schematic of the average times outlined in panel B showing the timing and duration of VP7 loss (green bar), Ca2+ loss (blue bar), and overall DLP release (red bar) in relation to t1.

