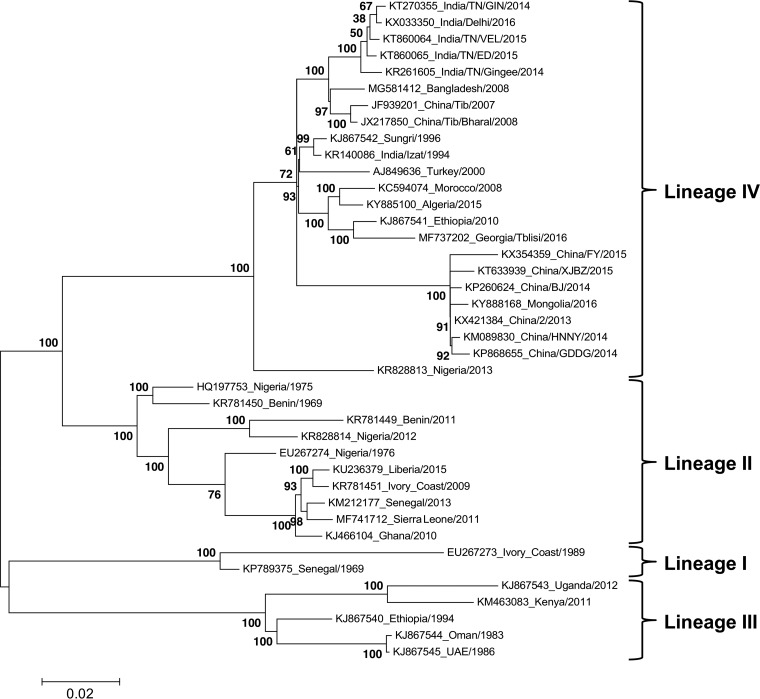
FIG 1.
Phylogenetic tree of PPRV showing lineages I to IV. A phylogenetic tree showing the genetic distances between the available full-length PPRV genomes was calculated as described in Materials and Methods using MEGA6. The tree with the highest log likelihood is shown, with the percentage of trees in which the associated taxa clustered together in the bootstrap (500 replicates) shown next to the branches. The tree is drawn to scale, with branch lengths measured in the number of substitutions per site; the scale bar shows 0.02 substitutions per site. The labels at the ends of the branches show the accession number of the genome sequence and the country and year of the virus’s isolation. The clades considered as lineages I to IV are shown on the right.

