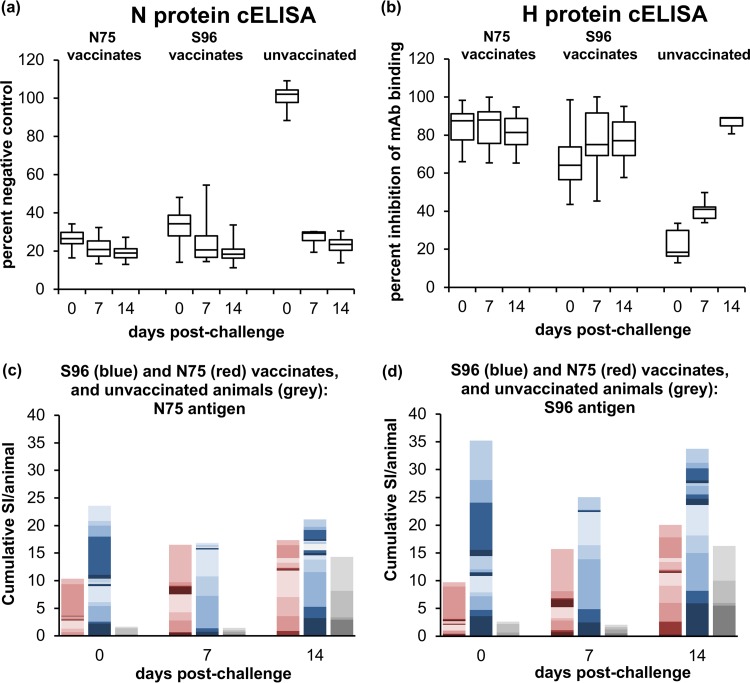
FIG 8.
Immune responses in goats after challenge with PPRV. Goats vaccinated with live PPRV vaccines were challenged 28 dpv, along with unvaccinated controls. Heparinized blood and serum was collected from each animal at 0, 7, and 14 days postinfection (dpi). (a and b) Serum samples were assayed for antibodies to the PPRV N protein (a) and the PPRV H protein (b) using available cELISA kits. The N protein cELISA was applied to all samples from all five challenge studies; the H cELISA was only applied to samples from animals challenged with PPRV/Ivory Coast/89, PPRV/Nigeria/76/1, and PPRV/Iran/2011. The numbers of serum samples assayed at the time points shown were as follows: 25/25/20 for vaccinates and 8/7/4 for controls (a) and 14 at each time point for N75, 15 at each time point for S96 vaccinates, and 6/6/3 for controls (b). The data in panels a and b are presented as box-and-whisker plots, in which the bars span the minimum and maximum values and the boxes shows the ranges from the first to the third quartile. The central horizontal line in each box shows the median value. (c and d) PBMCs were prepared from the heparinized blood, and the proliferation of cells in response to PPRV antigen was assayed as described for Fig. 3. Proliferation was stimulated with protein from cells infected with N75 (c) or protein from cells infected with S96 virus (d). The SI was measured as the proliferation relative to that seen in PBMCs incubated with protein from uninfected cells. The data are presented as stacked bar plots showing the SI for each animal, using different shades to delineate the contributions of different animals to the cumulative SI for the group of vaccinates at that time point. Data from individual animals vaccinated with N75 are in red shades, data from individual animals vaccinated with S96 are in blue shades, and data from individual unvaccinated animals are in gray shades. To allow for the various number of animals in each group, the values have been scaled before plotting by dividing by the number of animals in each group. Data were obtained for samples from animals challenged with PPRV/Nigeria/76/1 and PPRV/Sudan/Sennar/72; data were also obtained for the vaccinates challenged with PPRV/Iran/2011, but not from unvaccinated animals infected with this virus, whose white cell counts at 7 dpi were too low for the assay to be carried out and were euthanized before 14 dpi. The numbers of PBMC samples assayed at each time were 14/9/12 for N75 vaccinates, 15/10/14 for S96 vaccinates, and 4/4/4 for unvaccinated animals. Note that the data for 0 dpc are the same as that shown in Fig. 2 and 3 for 28 dpv and are included here for comparison.

