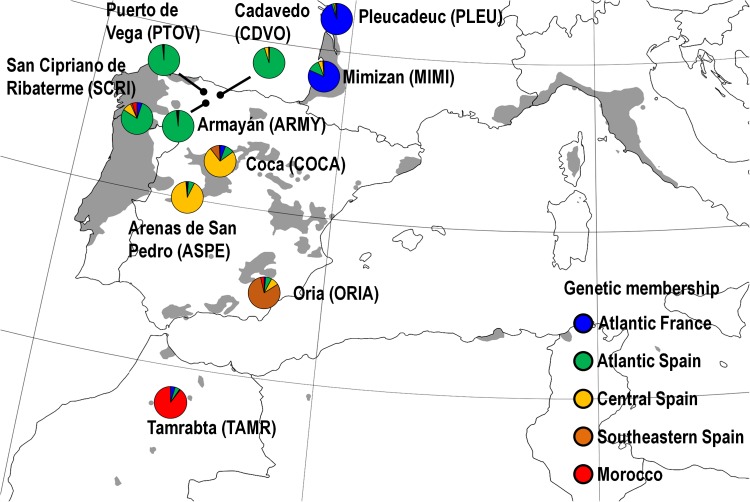
FIGURE 1.
Natural distribution range of maritime pine (shaded area) and location of the ten studied populations (colored circles). Circle color represents the genetic membership of the populations based on STRUCTURE (see Supplementary Methods SM2). Populations were coded with four capital letters (in brackets). Modified from EUFORGEN (2009).

