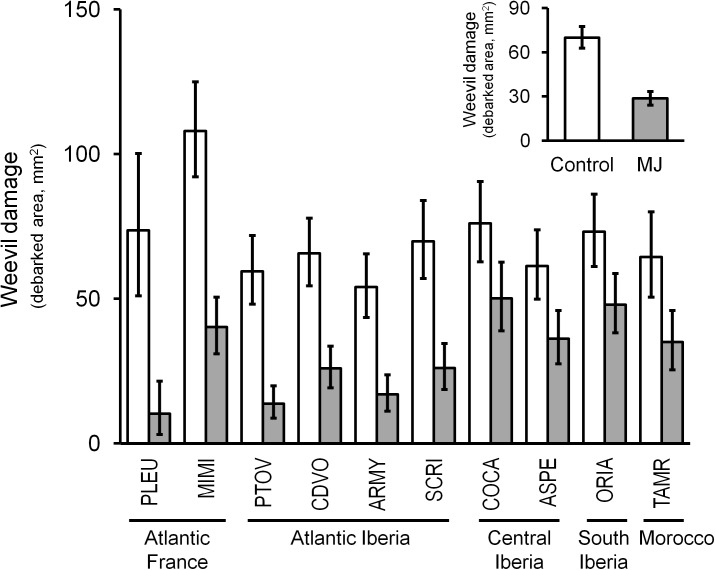
FIGURE 3.
Intraspecific genetic variation in constitutive resistance (white bars) and MJ-induced resistance (gray bars) to the pine weevil across 10 maritime pine populations representing its main distribution range, grouped by the main genetic groups in the species. The inset panel shows the overall effect of the MJ-induction on the resistance to weevil herbivory in the species. Bars represent the least square mean ± SE (N = 8–25 plants for each population; N = 197–205 plants for each induction treatment in the small panel). A total sample size of 205 genotypes was used.

