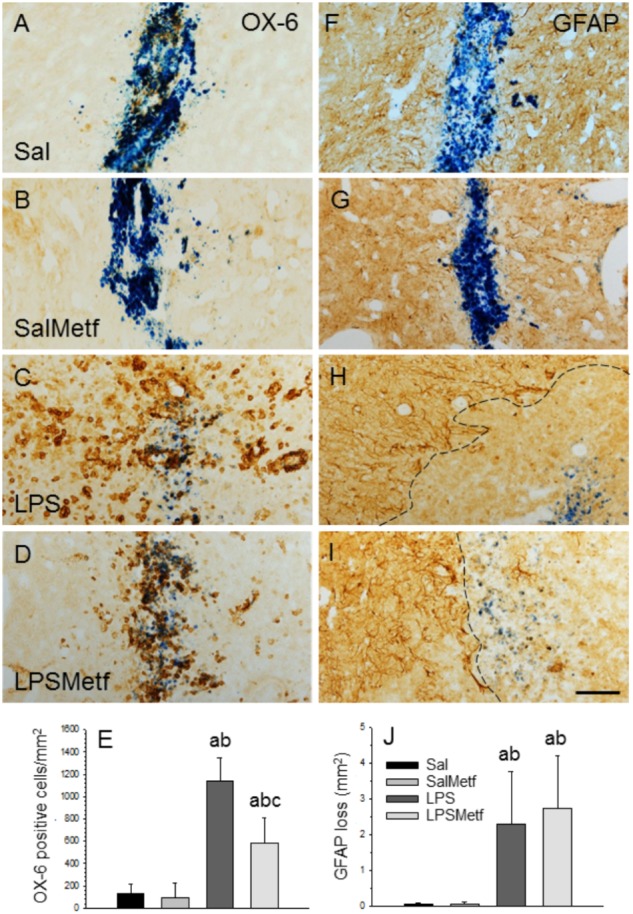
FIGURE 4.

Effect of metformin and LPS on microglia and astroglia, evaluated by immunohistochemistry with the OX-6 (microglia; A–D) and the anti-GFAP (astroglia, F–I) antibodies. (A,F) Animals injected with saline solution in the SN plus oral administration of water; (B,G) animals injected with saline solution in the SN plus oral administration of metformin; (C,H) animals injected with LPS in the SN plus oral administration of water; (D,I), animals injected with LPS in the SN plus oral administration of metformin. The activation of microglia induced by LPS (C) was partially prevented by metformin (D). GFAP immunohistochemistry showed an important loss of astroglia induced by LPS (H) that was not prevented by metformin (I). The dashed line in (H,I) marks the left boundary of the area lacking GFAP staining. Metformin alone had no effect on either microglia (B) or astroglia (G). (E) Quantification of the density of OX-6 positive cells. Results are mean ± SD of four independent experiments, expressed as number of cells per mm2. (J) Quantification of the areas lacking GFAP immunostaining. Results are mean ± SD of four independent experiments, expressed as mm2. Statistical significance (one-way ANOVA followed by the LSD post hoc test for multiple comparisons): a, compared with the control group; b, compared with the SalMetf group; c, compared with the LPS group; p < 0.01 for (E) and p < 0.05 for (J). Scale bar, 50 μm.
