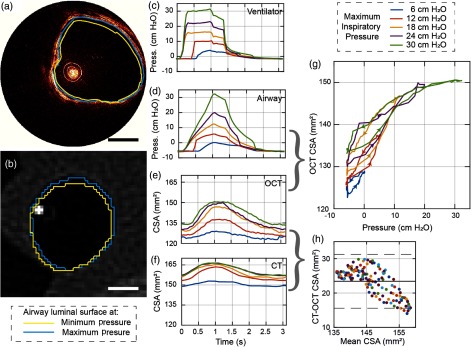
Fig. 3.
Dynamic airway imaging (a), (b) aOCT and CT images showing the airway under MIP of 12 cm (Video 1); (c) inspiratory pressures measured at the ventilator; (d) intraluminal pressures measured in the airway with the pressure catheter; (e) CSA derived from aOCT scans; (f) CSA derived from CT scans; (g) pressure versus aOCT-derived CSA hysteresis curves; (h) Bland-Altman plot comparing the CT- and aOCT-derived CSA; . (Video 1, MPEG, 1.7 MB [URL: https://doi.org/10.1117/1.JBO.23.10.100501.1].)

