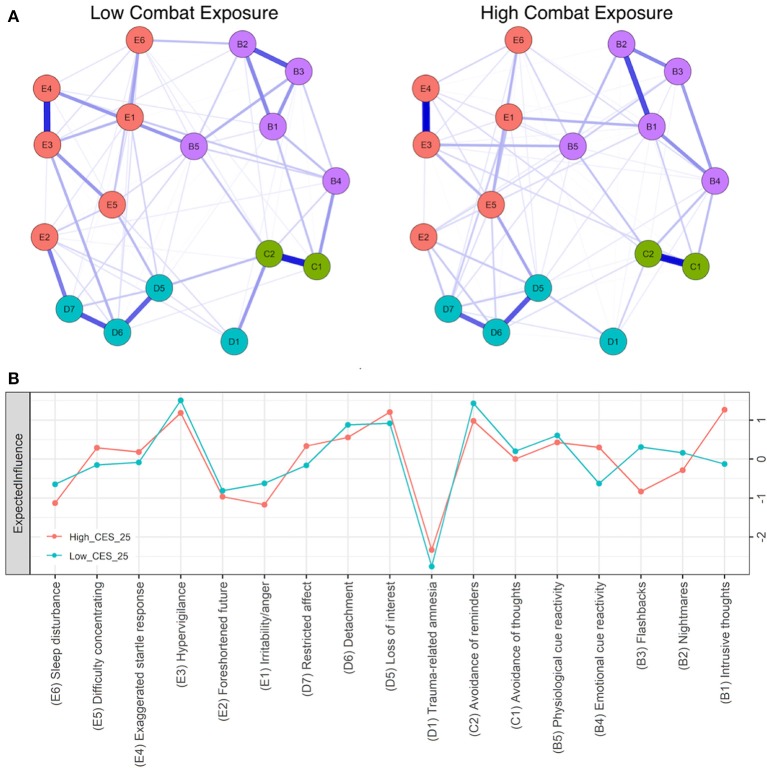
Figure 2.
(A) Seventeen-node DSM-IV PTSD symptom network comparison for low (left) and high (right) combat exposure groups. Blue lines represent positive associations, red lines negative ones, while the width and brightness of an edge indicate association strength. E1:B1 is significantly stronger in high combat exposure. Both networks are set to the same maximum edge (0.55) for comparison (B) Individual node strength values shown as standardized z-scores for high (CES > 25, orange) vs. low (CES < 25, blue) combat exposure.

