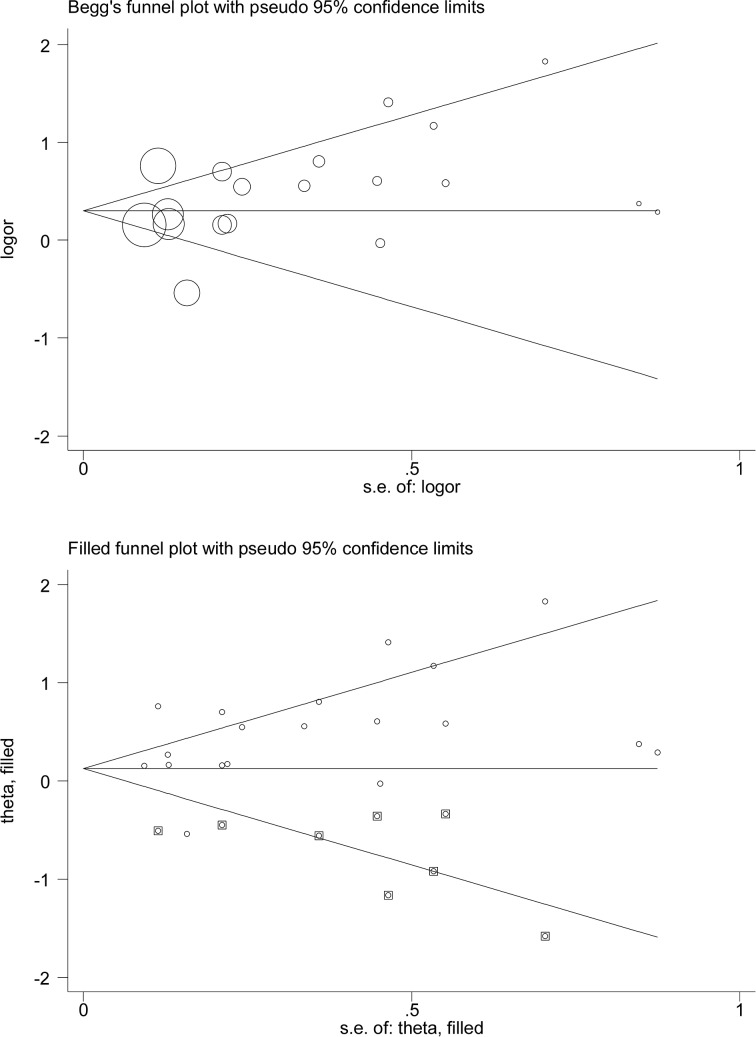
Figure 3. Begg’s (the upper panel) and filled (the lower panel) funnel plots for the association of metabolic syndrome with COPD risk.
Abbreviations: COPD, chronic obstructive pulmonary disease; logor, the logarithm of odds ratio; S.E., standard error. In Begg’s funnel plot, the symbols denoting the data in the plot are sized proportionally to inverse variance. In filled funnel plot, hollow circles denote the actual studies included in this meta-analysis, and solid squares denote missing studies required to achieve symmetry of funnel plot.

