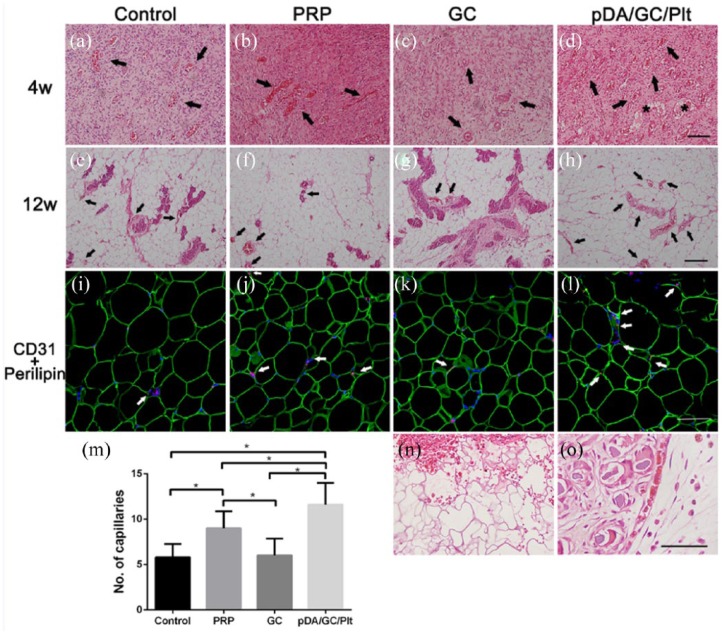
Figure 10.
Histological analysis of regenerative adipose tissue at week 4 (a: control, b: PRP, c: GC, d: pDA/GC/Plt) and week 12 (e: control, f: PRP, g: GC, h: pDA/GC/Plt). Black arrows show the vascular connective tissue, asterisk represent the small adipocytes. Scale bar = 0.1 mm. CD31 staining of the control (i), PRP (j), GC (k), and pDA/GC/Plt (l) groups showed vessel density at week 12. Red denoted the CD31-positive cells, green denoted the adipocytes, and blue denoted the nuclear. Scale bar = 0.1 mm. Vessel density was evaluated in week 4 samples (m,*p < 0.05). A relatively intact porous structure of GC was observed in pDA/GC/Plt group at 4 weeks (n) (scale bar = 0.1 mm), while only GC debris was found in pDA/GC/Plt group at 12 weeks (o) (thin arrow, scale bar = 0.5 mm).

