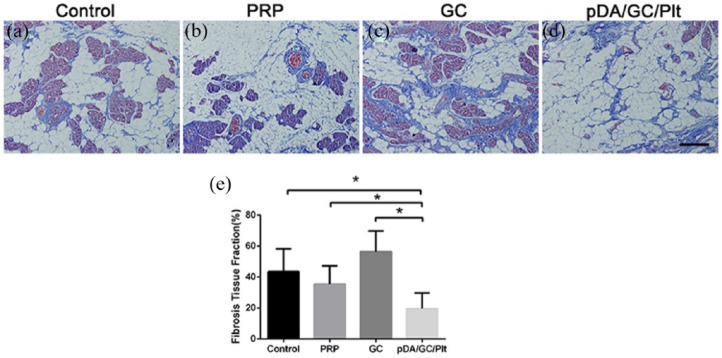
Figure 11.
Masson staining of week 12 samples of chamber tissues from the control group (a), PRP group (b), GC group (c), and pDA/GC/Plt group (d). Scale bar = 0.1 mm. Statistical evaluation of fibrosis area in the four groups: control: 42.80% ± 12.380%; PRP: 35.40% ± 11.983%; GC: 56.40% ± 13.39%; and pDA/GC/Plt: 19.20% ± 9.338% (e).

