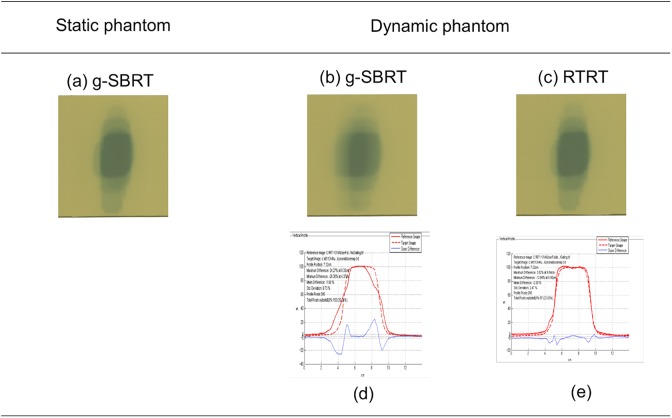
Figure 5.
Dose distribution on Gafchromic films using phantoms for a target volume with a lateral diameter about 4-cm on this figure. Two-dimensional dose distributions of g-SBRT using (A) the static phantom and (B) the dynamic phantom, and (C) that with real-time tumor-tracking radiotherapy (RTRT) using the dynamic phantom. Dose profiles at the center of the target volume of (D) g-SBRT and (e) RTRT using the dynamic phantom. The dynamic phantom was moving in a cos4 manner with a period of 3 seconds and an amplitude of 20 mm along the lateral direction. The red dotted lines in (D) and (E) are the dose profiles of g-SBRT using the static phantom. The red solid lines in (D) and (E) are the dose profiles of g-SBRT and RTRT using the dynamic phantom, respectively. The dose difference between the static phantom and the dynamic phantom are shown as blue solid lines in (D) and (E) for g-SBRT and RTRT, respectively.

