Figure 4.
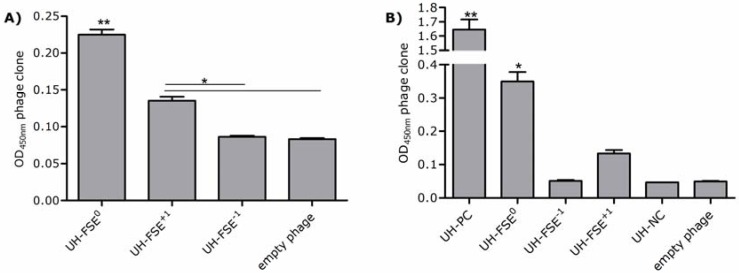
(A) Detection of ApoE expression. ApoE expression of UH-FSE0, UH-FSE−1 and UH-FSE+1 was measured via ELISA. Empty phage was used to determine background values. Experiments were performed twice independently. All samples were tested in duplicate in one ELISA. ** p < 0.001; * p < 0.01 as evaluated by one-way ANOVA followed by Tukey post-hoc test; (B) Detection of E-tag expression. E-tag expression of UH-FSE0, UH-FSE−1 and UH-FSE+1 was measured via ELISA. UH-PC was used as a positive E-tag display control whereas UH-NC was used as a negative E-tag display control. Empty phage was taken along to determine background values. Experiments have been performed 4 times independently, all samples were tested in duplicate. ** p < 0.001; * p < 0.01 except for UH-FSE0vs. UH-FSE+1p < 0.05 as evaluated by one-way ANOVA followed by Tukey post-hoc test.

