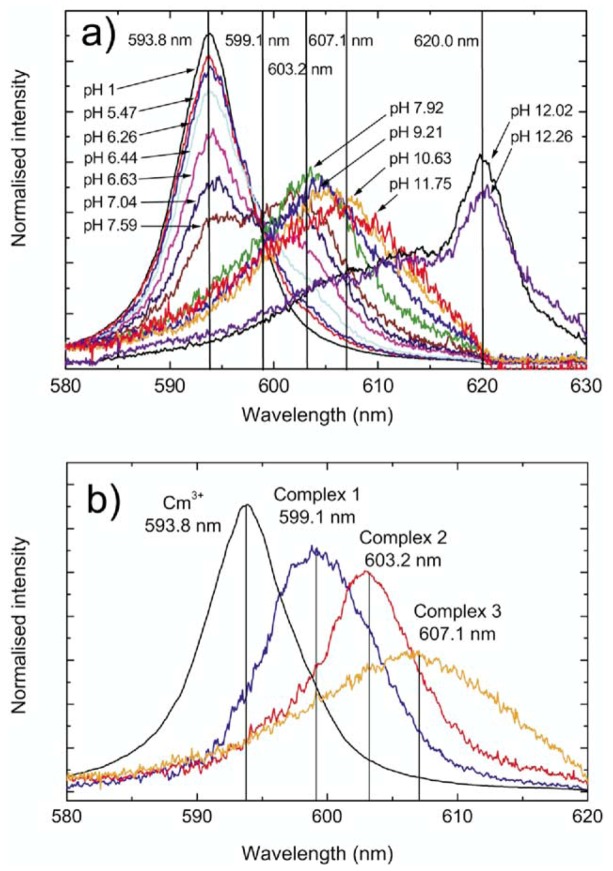
Figure 6.
Cm-fluorescence spectra at different pH values in the presence of Ca-montmorillonite. (a) Cm fluorescence spectra normalized to same peak area. Total Cm concentration = 2.5 × 10⁻⁷ mol/L, m/V ratio = 0.25 g/L, 0.066 mol/L Ca(ClO4)2 solution. (b) Spectra of individual surface complex species derived from peak deconvolution. Surface precipitated species (λ = 620 nm) are not considered in the peak deconvolution [21].

