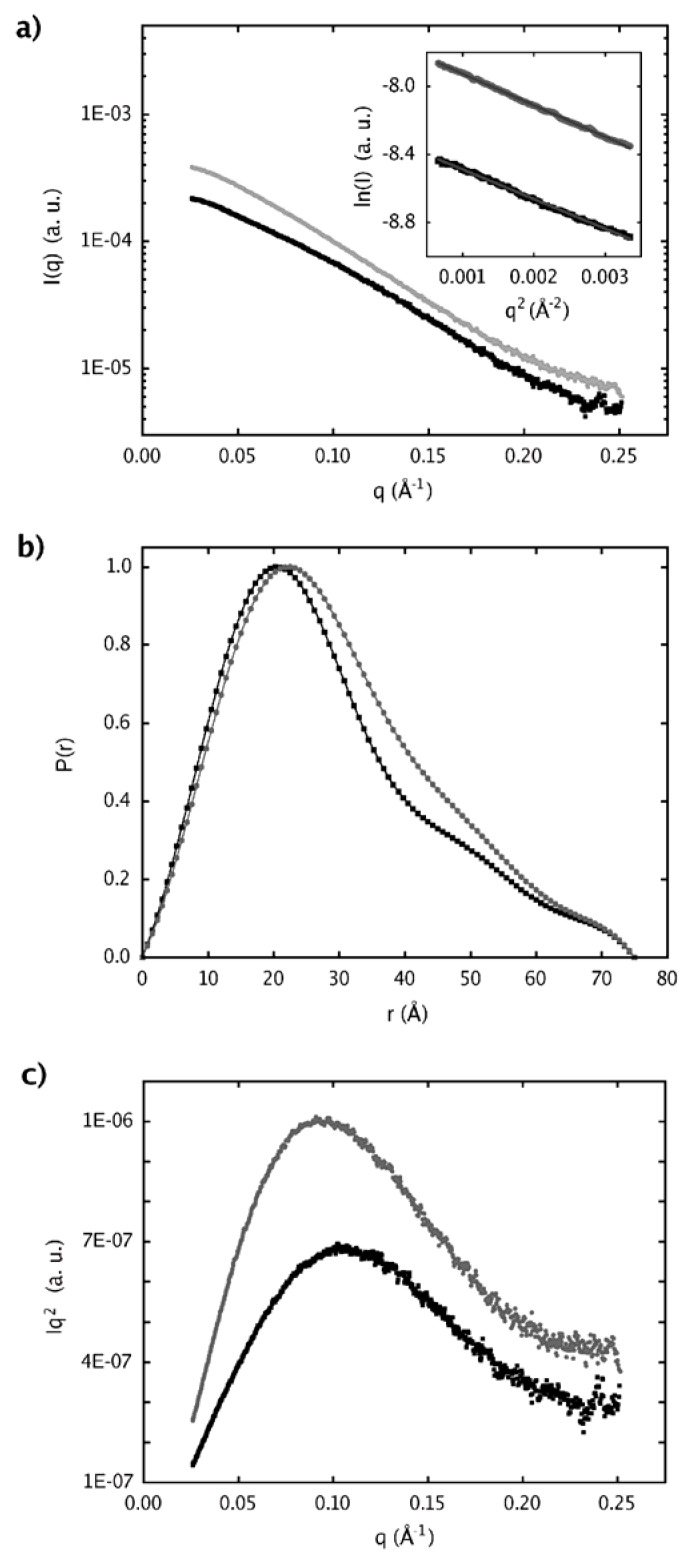
Figure 6.
Small Angle X-ray Scattering data plots. (a) Experimental scattering curves and Guinier region with its linear data fit. (b) Distance distribution functions, p(r). (c) Kratky plot. Black squares represent the SAXS data for the native protein (sPLA2, ~4 mg/mL), and the SAXS data for the protein after treatment with naringin (sPLA2-Nar, ~7 mg/mL) are shown as gray circles.

