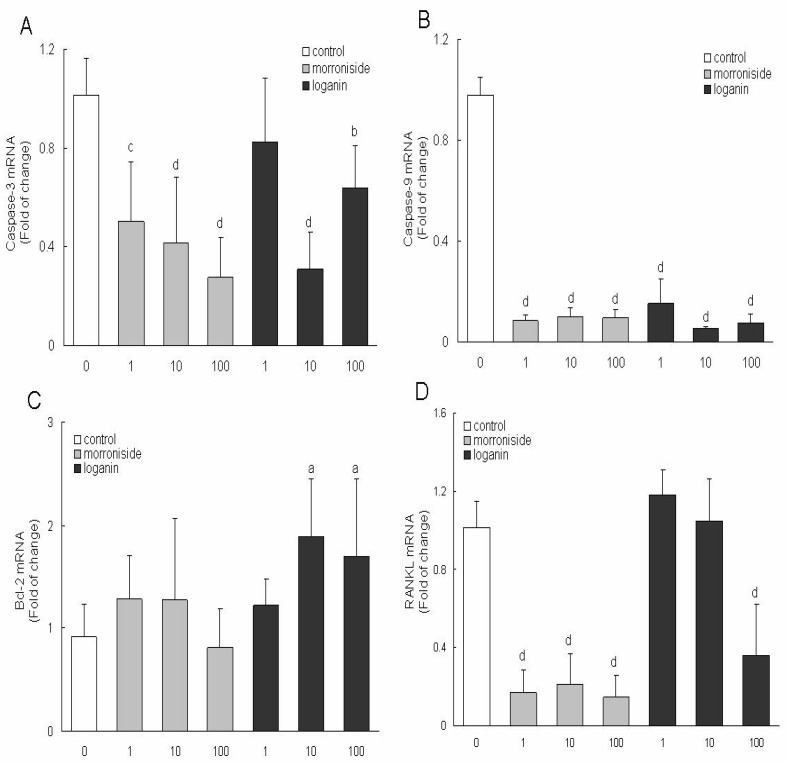
Figure 2.
The amounts of caspase-3 mRNA in MC3T3-E1 cells; B: The amounts of caspase-9 mRNA in MC3T3-E1 cells; C: The amounts of bcl-2 mRNA in MC3T3-E1 cells; D: The amounts of RANKL mRNA in MC3T3-E1 cells.
MC3T3-E1 cells were treated with various concentrations (1, 10, 100 μg/mL) of morroniside and loganin for 48 h, then the amounts of caspase-3, caspase-9, bcl-2 and RANKL mRNA were assessed by RT-PCR. Each value represents as mean ± S.D.(n = 3), Significant difference from normal control at pa < 0.05, pc < 0.005, pd < 0.001.

