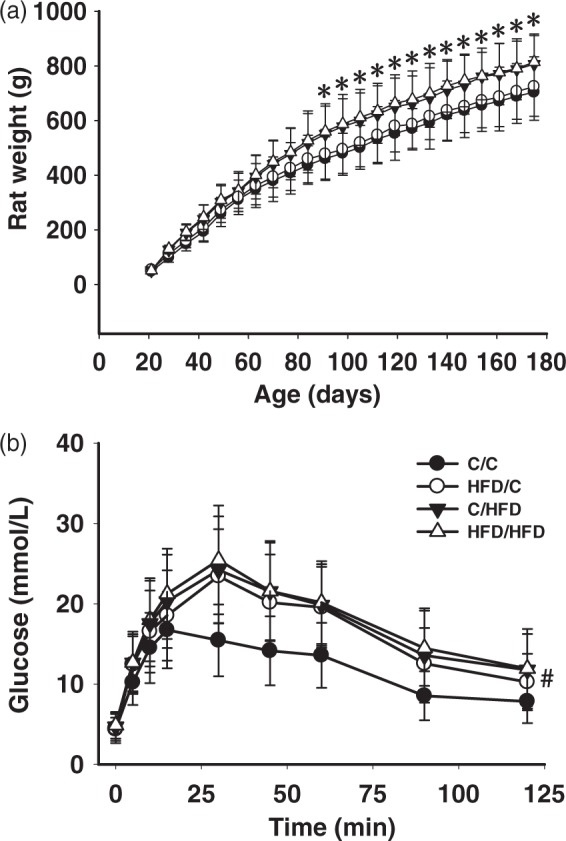
Figure 1.

Growth rate (A) and glucose metabolism (B) in groups. (a) Body weight remained unchanged in HFD/C rats during the experiment, compared with C/C offspring. (b) Oral glucose tolerance test (orogastric gavage of 2 g/kg/4 ml glucose) was significantly impaired in HFD/C rats. *P < 0.05 C/HFD group versus HFD/C group at the same time period. #P < 0.05 HFD/C group versus C/C group. Results are shown as mean ± SD. Rat weight: C/C (n = 10), HFD/C (n = 12), C/HFD (n = 12), and HFD/HFD (n = 10). Glucose tolerance test: C/C (n = 6), HFD/C (n = 8), C/HFD (n = 8), and HFD/HFD (n = 7).
