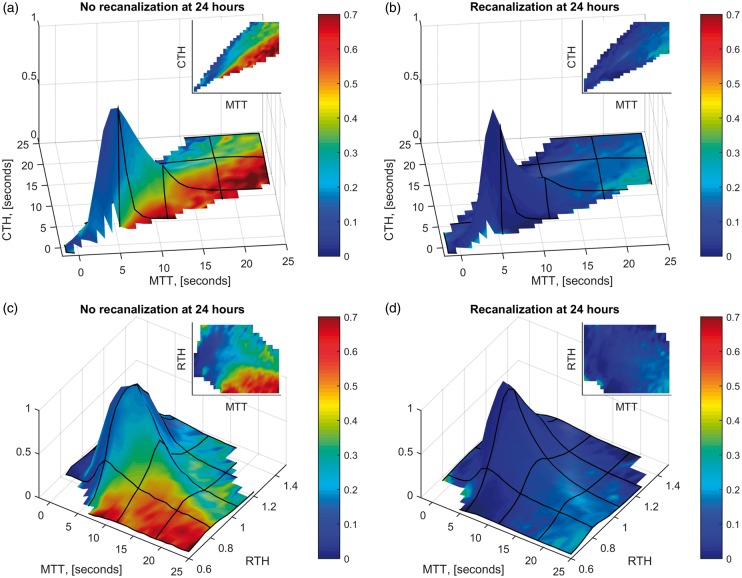
Figure 3.
Voxel-wise infarction rate depending on MTT, CTH, and RTH. Plots of infarction ratios (as surface colors) as a function of MTT and CTH for mismatch tissue in which recanalization was not achieved at 24 h (Panel A) and in which recanalization was achieved (Panel B), respectively. Panels C and D show the corresponding plots as functions of MTT and RTH. The heights of the surface plots indicate the relative proportion of tissue with a given combination of these parameters. For tissue with MTT ≤5 s, only a very small proportion went on to infarct at follow-up (recanalization: 7.3%; no recanalization: 14%).

