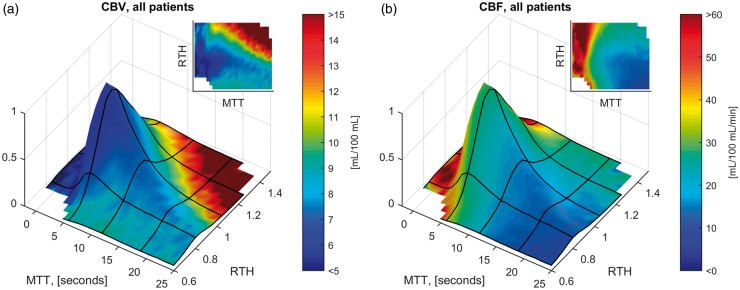
Figure 5.
Relation between RTH, CBF and CBV. Surface plots of mean voxel CBV (Panel A) and CBF (Panel B), indicated as surface colors, as a function of MTT and RTH. The height of the surface plots indicate the relative proportion of tissue with a given combination of these parameters. Note that CBV is generally elevated in the tissue-at-risk, corresponding to an average value of 8.0 mL blood/100 mL, or ∼3 times that of normal appearing white matter.44 Additionally, mean CBV was higher in tissue with prolonged MTT (> 5 vs. ≤ 5 seconds): 8.3 vs. 6.9 mL/100 mL. Mean CBF was 43 mL/100 mL/min in tissue with MTT ≤5 s vs. 21 mL/100 mL/min in tissue with prolonged MTT.

