Figure 4.
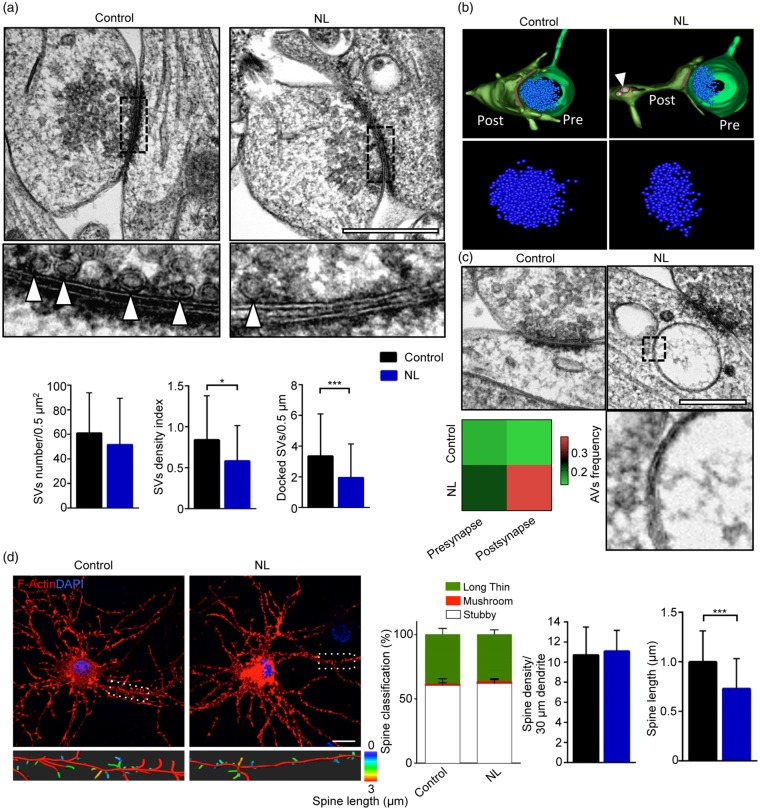
Reduced vesicle density and postsynaptic morphological alterations in NL neurons. (a) Example of electron micrographs of synaptic contacts from Control and NL neurons. NL neurons show reduced clustering of SV at presynaptic boutons (Control vs. NL p = 0.0465), as well as a significant reduction of docked SV (Control vs. NL p < 0.0001). Higher magnification shows docking vesicles (white arrowheads) at the active zone. (b) Representative 3D reconstruction of transmission electron tomography showing reduced SV clustering in NL synapses (Pre – presynaptic terminal; Post – postsynaptic terminal; arrowhead indicates an AV). (c) Example of electron micrographs of synaptic contacts from Control and NL neurons. NL increases the frequency of AVs at the postsynaptic site (Control vs. NL p = 0.0148). The higher magnification shows the typical double membrane characterizing AVs. (d) Representative confocal images of Control and NL neurons overexpressing LifeAct construct to visualize F-Actin (RFP-tagged). Control and NL neurons have comparable number of dendritic spines, but NL reduces the spine length (Control vs. NL p = 0.0007). Experiments were performed in N = 3 independent replicates. From each independent specimen, 45–50 synapses for condition were evaluated in ultrastractural analysis. Data are displayed as Mean ± SD (*p < 0.05, ***p < 0.001). Scale bars represent 500 nm in (a) and (c), 15 µm in (d).

