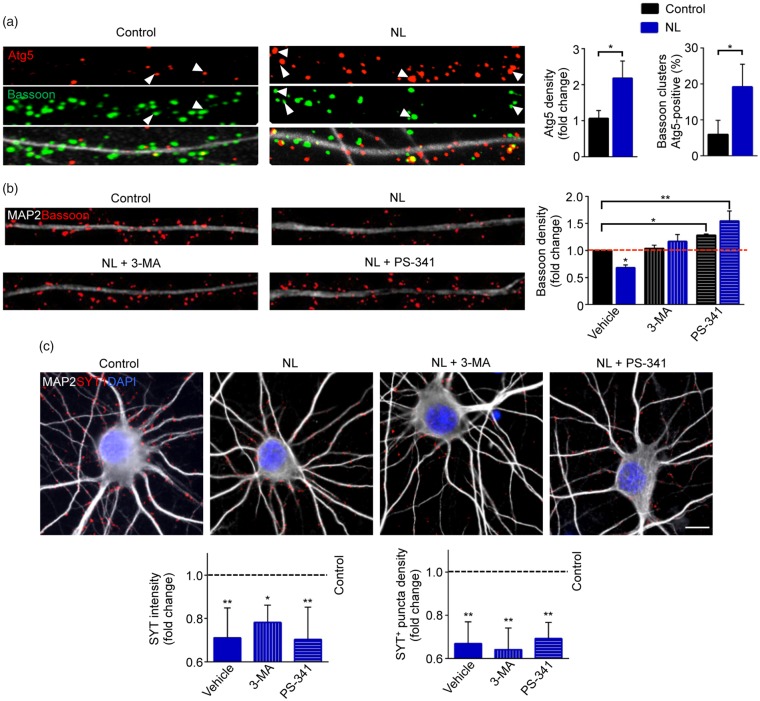
Figure 5.
Blocking degradative pathways prevents Bassoon degradation, but not the decrease of SV release. (a) Representative confocal images of dendrites (30 µm) from Control and NL neurons immunostained against MAP2, Atg5 and Bassoon. NL increases Atg5 clusters along the dendrites (Control vs. NL p = 0.0387), as well as the number of Bassoon synaptic clusters positive for the autophagic marker (Control vs. NL p = 0.0475). (b) Representative images of dendrites (30 µm) from Control and NL neurons. Cells were treated with DMSO (Vehicle), 3-MA or PS-341 and immunostained against MAP2 and Bassoon. Both 3-MA and PS-341 treatments prevent the reduction of bassoon clusters number upon NL (Control + Vehicle vs. NL + Vehicle p = 0.0196; Control + Vehicle vs. Control + PS-341 p = 0.0487; Control + Vehicle vs. NL + PS-341 p = 0.0016; NL + Vehicle vs. NL + 3-MA p = 0.0034; NL+Vehicle vs. NL+PS-341 p < 0.0001; NL + 3-MA vs. NL + PS-341 p = 0.0196). (c) Anti-Synaptotagmin-1 antibody uptake assay was performed in Control and NL neurons treated with DMSO (Vehicle), 3-MA or PS-341. Blocking degradative pathway does not restore SV release (Syt1 intensity: Control+Vehicle vs. NL+Vehicle p = 0.0093; Control+Vehicle vs. NL + 3-MA p = 0.0183; Control+Vehicle vs. NL+PS-341 p = 0.0082. Syt1 numbers: Control+Vehicle vs. NL+Vehicle p = 0.005; Control+Vehicle vs. NL+3-MA p = 0.0036; Control+Vehicle vs. NL+PS-341 p = 0.0063). Experiments were performed in N = 3 independent replicates. Data are displayed as Mean ± SD. (*p < 0.05, **p < 0.01). Scale bars represent 10 µm in (c).

