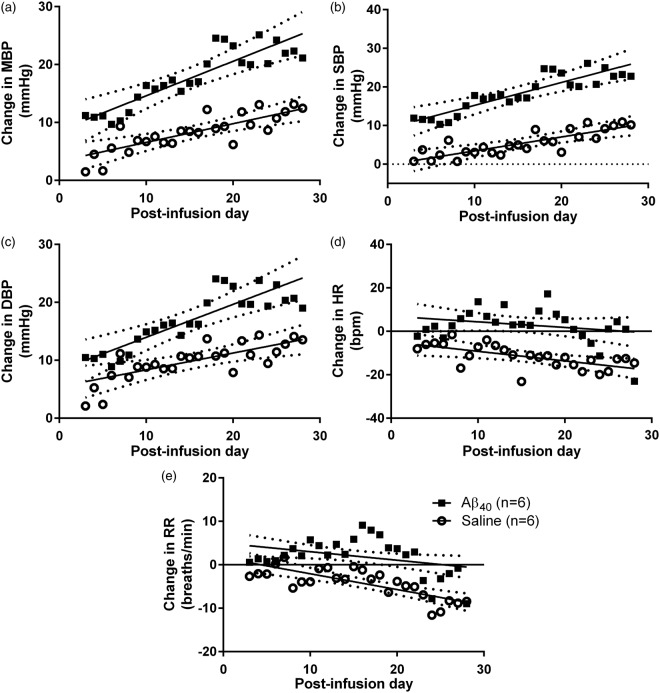
Figure 1.
Change in BP, HR and RR in High-Salt DAHL/SS. Change in BP, HR and RR in high salt DAHL/SS over 28 days of Aβ (n = 6) or saline (n = 6) infusion. Each data point represents the group mean value on a given day during infusion. Best-fit linear regression (solid) and 95% CI (dotted) lines are shown. A comparison (sum-of-squares F-test) of best-fit regression lines tested the null hypothesis (H0) that a single linear regression line could fit the combined data sets for the change in HR, RR, MBP, SBP and DBP, relative to baseline, after infusion of Aβ or saline. H0 was rejected for each comparison. There was a highly significant greater effect of Aβ infusion compared to control (saline) infusion on (a) MBP (F2,288 = 38.45, p < 0.0001), (b) SBP (F2,288 = 61.50, p < 0.0001), (c) DBP (F2,288 = 19.95, p < 0.0001), (d) HR (F2,288 = 23.94, p < 0.0001), (e) RR (F2,288 = 26.51, p < 0.0001). The increase in MBP, SBP and DBP was much greater in Aβ40- than saline-infused animals (P < 0.0001), and the decline in HR and RR less marked (P < 0.0001).

