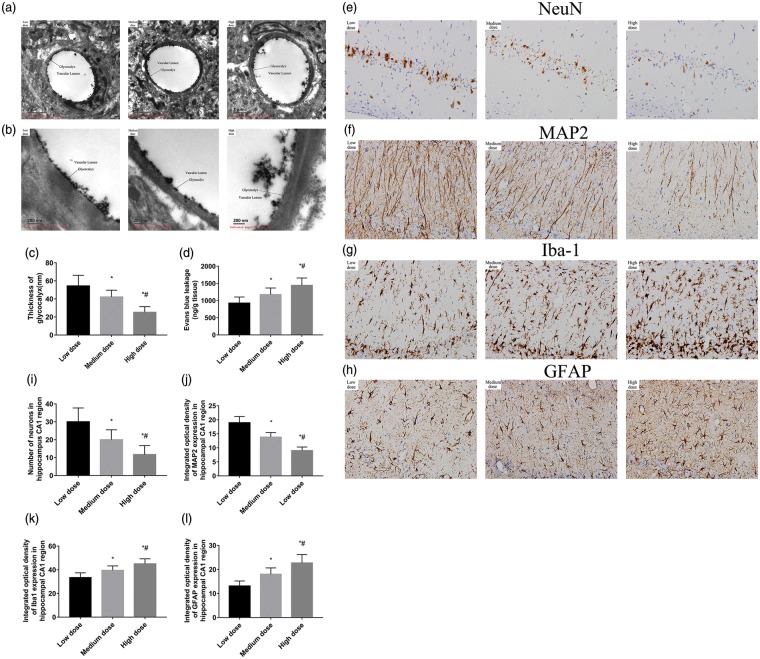
Figure 3.
Electron microscopic views of the cerebral capillaries endothelial glycocalyx in cortex and hippocampus 24 h after CA/CPR. (a) Electron microscopic overview of lanthanum-stained rat cerebral capillaries (bar = 2 μm). (b) Detailed pictures of glycocalyx on cerebral capillaries (bar = 200 nm). (c) The width of the endothelial glycocalyx (nm, mean ± SD) of cerebral capillaries. (d) Blood–brain barrier permeability evaluated using Evans blue in the whole brain at 24 h after CA/CPR (n = 6 per group). (e–h) Representative photomicrographs of immunohistochemistry for NeuN, MAP2, Iba-1, and GFAP in the hippocampal CA1 region of the three groups at seventh day after ROSC. All images were captured at ×400 magnification. Scale bar indicates 100 μm, n = 6 for all groups. (i–l) Semi-quantitative results of NeuN, MAP2, Iba-1, and GFAP, respectively. NeuN staining cells are reported as positive number, while MAP2, Iba-1, and GFAP staining as the relative intensity of staining (percent) of the area. Data are presented as mean ± SD. Low dose: low dose group; Medium dose: medium dose group; High dose: high dose group. *p < 0.05 vs. low dose group. #p < 0.05 vs. medium dose group. CA: cardiac arrest; CPR: cardiopulmonary resuscitation; SD: standard deviation; NeuN: neuronal nuclei; MAP2: microtubule-associated protein 2; Iba-1: ionized calcium-binding adapter molecule 1; GFAP: glial fibrillaryacidic protein; ROSC: return of spontaneous circulation.

