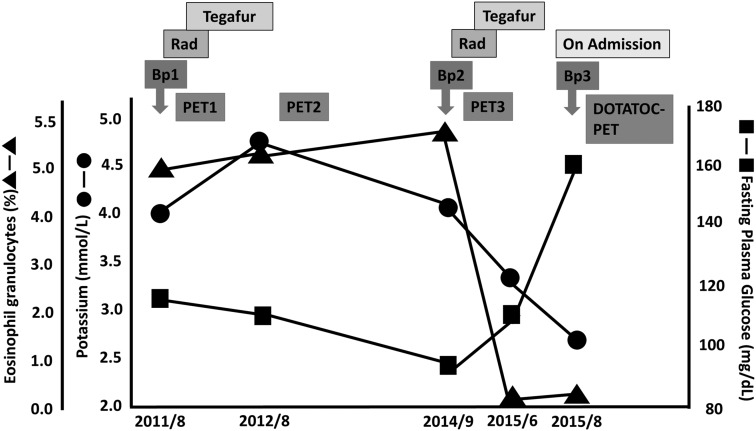
Figure 1.
Changes in concentrations of serum potassium and glucose and eosinophil count during the clinical course of the disease. The symbols depict potassium (•), fasting plasma glucose (▪), and eosinophils (▲). The medical treatment undertaken is shown at the top: number of chemotherapy treatments (with tegafur), radiation (Rad), and biopsies (Bp) are shown by arrows. PET, positron emission tomography; DOTATOC, 1,4,7,10-tetraazacyclododecane-N,N′,N″,N‴-tetraacetic acid-d-Phe1-Tyr3-octreotide.

