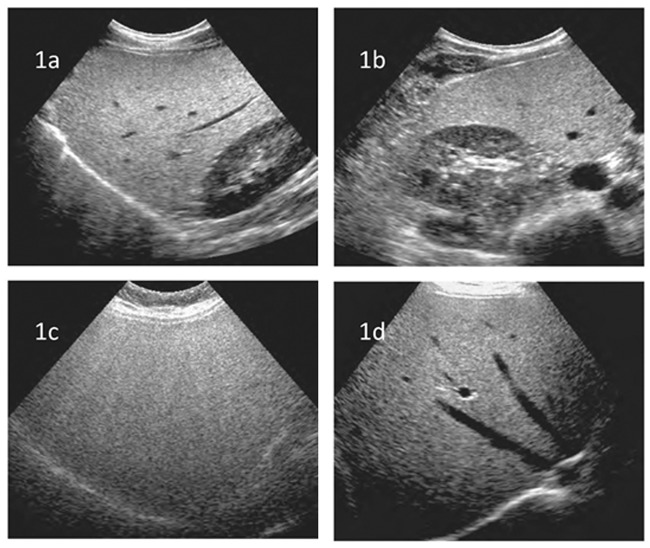
Figure 1.
Ultrasound findings. (a, b) B-mode ultrasound images of the liver show a mild increase in liver echogenicity compared with the kidney. (c, d) B-mode ultrasound images of the liver show grade III diffuse fatty infiltration with a marked increase in liver echogenicity relative to the kidney and no visualization of the intrahepatic vessel borders, diaphragm, and posterior portion of the right lobe of the liver.

