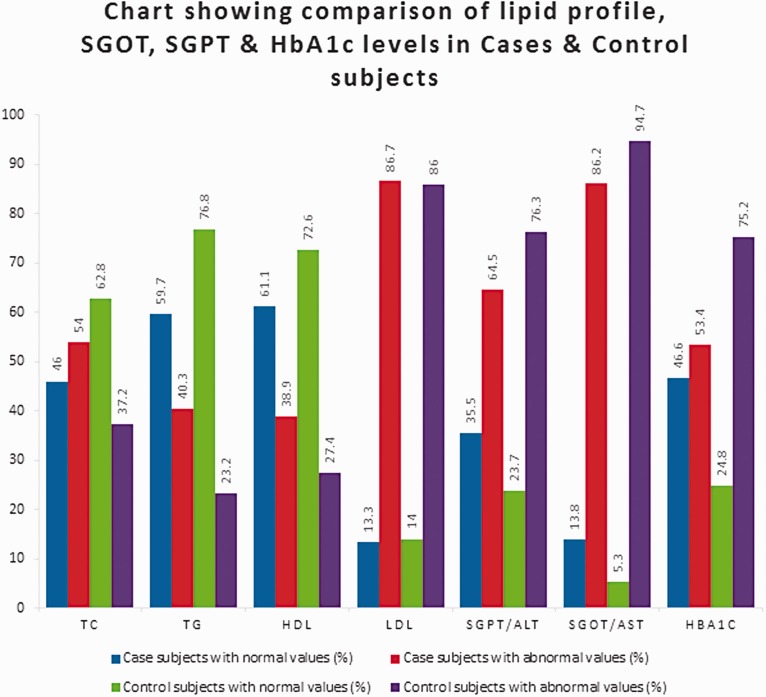
Figure 3.
Column chart showing distribution of lipid profile and serum GOT, GPT, and HbA1c levels in cases and controls. TC, total cholesterol; TG, triglycerides; HDL, high-density lipoprotein; LDL, low-density lipoprotein; GOT/AST, glutamic oxaloacetic transaminase/aspartate transaminase; GPT/ALP, glutamic pyruvic transaminase/alanine transaminase; HbA1c, glycosylated hemoglobin.

