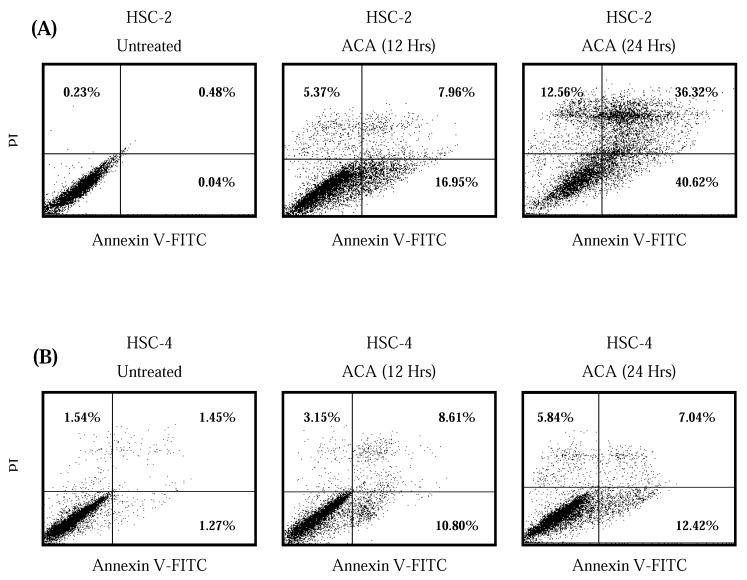
Figure 5.
Detection of apoptosis using flow cytometry after annexin V-FITC/ propidium iodide (PI) staining indicating that ACA potentiates apoptosis-mediated cell death after 12 hrs and 24 hrs of exposure. (A) HSC-2 cells treated with ACA; (B) HSC-4 cells treated with ACA. Viable cells are in the lower left quadrant, early apoptotic cells are in the lower right quadrant, late apoptotic cells are in the upper right quadrant and non-viable necrotic cells are in the upper left quadrant. Dot plots are a representative of 10,000 cells from a single replicate.

