Abstract
Background:
Muscular atrophy is the universal feature in patients with ICUAW. Muscles of the lower limb are more prone to early atrophy. Measurement of fat thickness is used to assess malnutrition. This study was designed to evaluate if, subcutaneous fat also reduces along with muscle thickness and if it can be reliably used as an indicator of nutritional assessment in critically ill patients using point of care ultrasound.
Materials and Methods:
An observational clinical study of 100 patients admitted to multidisciplinary intensive care units (ICUs). Total anterior thigh thickness, thickness of the rectus femoris muscle, fat thickness, and the combined thickness of vastus intermedius and rectus femoris were taken on day 1, 3, and 7 of ICU admission.
Results:
There was progressive loss of muscle mass from day 1 to day 7. Muscle loss was not only limited to rectus femoris, but vastus intermedius also showed a significant decrease as indicated by the bone to muscle measurement. Skin to bone measurement which includes both muscle and fat compartment showed a decline.
Conclusions:
There is potential utility of ultrasound for early detection and probable corrective measures to prevent ICUAW. The rectus femoris thickness, skin to bone, and bone to muscle thickness show statistically significant difference on day 3, day 7 compared to day 1. Fat layer did not show statistically significant decrease.
Keywords: Critical illness, muscles, ultrasonography
INTRODUCTION
Muscle weakness, usually generalized in intensive care units (ICUs) which cannot be attributed to any cause other than critical illness is termed ICU associated weakness (ICUAW) and is associated with long-term consequences from the medical and socioeconomic point of view.[1,2]
Hospital malnutrition is associated with increased morbidity and mortality, particularly among patients admitted to ICUs. Increased calorie deficits are common in the ICU. Consuming <75% of daily calorie requirements in the hospital setting is linked to poor outcomes.[3]
Muscular atrophy is the universal feature in patients with ICUAW, and it can start in early stages of critical illness (within hours of onset of the disease). Its development has been related to the acute inflammatory process and immobilization. Factors such as age, medications, comorbidities, muscular function before critical illness, nutrition, nervous, and muscular damage can contribute to the extent of damage and the muscular and functional recovery capacity.[4]
Few studies have shown that increase in protein intake in the early phase of critical illness will probably accelerate muscle loss during the 1st week.[5,6] The underlying mechanism for this is enhanced autophagy which occurs by nutrition restriction for a duration of 1 week.[6]
Muscle wasting in critically ill patients is associated with worse short- and long-term outcomes. Loss of mass and function of skeletal muscles start early in the first 24 h after admission to ICU and may persist for years. Loss of muscle mass is a major cause of ICU-acquired muscle weakness and is associated with delayed weaning, prolonged ICU and hospital stay and is an independent predictor of 1-year mortality.[7,8,9]
Skeletal muscle wasting in the critically ill patients is often misjudged by fluid retention. In such circumstances, the normal anthropometric methods of assessing changes in body mass and composition are not applicable, as all these techniques assume a normal state of hydration. Air displacement plethysmography technology, dual-energy X-ray absorptiometry, and bioelectric impedance are used to measure body composition. Muscle wasting in patients in the ICU is a recent field of interest and is to be explored.[10,11]
Muscles of the lower limb are more prone to early atrophy as they are weight bearing compared to the muscles of the upper limb as shown in a previous study. They showed that the size of the flexor compartment of the elbow did not show any change in the first 10 days of admission whereas the size of the anterior compartment muscles showed a greater decrease of thickness within the first 5 days. Thus, these muscles make a good choice for muscle mass assessment. Rectus femoris and vastus intermedius occupy most of the anterior thigh compartment. Hence, we measured the thickness of these muscles. This study also showed similar results.[12,13]
Measurement of fat thickness is used to assess malnutrition and fat content has been used to assess BMI along with nutritional status of an individual. Inflammation increases the breakdown of muscle and fat leading to its loss. No author has previously used ultrasound measurements for both fat and muscle. Previous studies have been focused primarily on muscle loss; we wanted to investigate whether fat loss also occurs in critical illness with muscle wasting.
New research has concluded that ultrasound measurements of the quadriceps muscle appear to be as accurate as those of computerized tomography and dual-energy X-ray absorptiometry, which are the gold standards for the evaluation of muscle mass.[14,15]
Point-of-care ultrasound is rapid, accurate, repeatable, nonexpensive, noninvasive, and without the risk of radiation. It can visualize a large muscle area and deeper located muscles.
It can be used in both stable and unstable patients. Performing repeated ultrasound examinations in critical patients is essential and improves the overall sensitivity of the examination. This has become a standard of care in critical care.
B-mode ultrasonographic evaluation of skeletal muscles (in particular, rectus femoris) is an emerging and reliable tool to assess muscle changes over time.[16]
We use point-of-care ultrasound in our ICU regularly, and this study was designed to evaluate muscle and fat thickness as an indicator of nutritional assessment in critically ill patients. Therefore, this study was designed to evaluate if subcutaneous fat also reduces along with muscle thickness and if it can be reliably used as an indicator of nutritional assessment in critically ill patients using point-of-care ultrasound.
The purpose of the present study was as follows:
To measure muscle wasting and fat loss in patients in the ICU over a period of 7 days
To determine whether a correlation could be identified between loss of muscle and loss of fat
To verify whether ultrasound measurements are a valid and practical measurement tool to document muscle mass and fat thickness as a routine in ICU patients.
MATERIALS AND METHODS
Study design
We performed an observational clinical study at our institution, in patients admitted in our multidisciplinary ICU including patients of age 18–90 years and anticipated ICU stay time of more than 7 days. The study excluded pregnant patients, patients with amputated lower-limb, primary neuromuscular pathology, disseminated cancer, muscular dystrophies, long-term critically ill patients shifted from other hospitals.
On day 1 of ICU admission, in supine position, using a permanent marker pen, a straight line was drawn from the anterior inferior iliac spine to the superior border of patella in the right leg and the midpoint was marked. The measurement is made at the same point every time. Using a portable ultrasound set (M-turbo Sonosite®) with a high frequency linear transducer (5–10 MHz), the transducer was placed perpendicular to the long axis of the muscle (i.e., perpendicular to the major axis of the limb) and the transverse view of the anterior thigh was obtained with no pressure on the skin by the same observer. The following measurements were made [Figure 1] from B-mode: total anterior thigh thickness (measured in centimeters from the skin to the anterior border of the femur), thickness of the rectus femoris muscle (measured in centimeters from the internal borders of the rectus femoris muscle to the external border of the same), the combined thickness of vastus intermedius, rectus femoris, and the fat thickness calculated by the difference between skin to bone and bone to muscle. At the same mid-point, similar measurements were made on day 3 and day 7.
Figure 1.
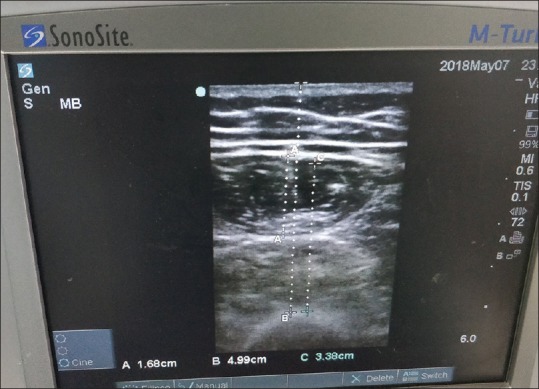
(A) Rectus femoris thickness; (B) skin to bone thickness and (C) bone to muscle thickness
Statistical analysis
The Statistical software SPSS 18.0 (IBM corporation), and R environment version. 3.2.2 (R Development Core Team)were used for the analysis of the data and Microsoft Word and Excel have been used to generate graphs, tables, etc.
Descriptive and inferential statistical analysis has been carried out in the present study. Results on continuous measurements are presented on mean ± standard deviation (minimum-maximum), and results on categorical measurements are presented in numbers (%). The significance is assessed at 5% level of significance. The following assumptions on data are made, assumptions: (1) Dependent variables should be normally distributed, (2) samples drawn from the population should be random, cases of the samples should be independent.
Student t-test (two-tailed, independent) has been used to find the significance of study parameters on continuous scale between two groups (Intergroup analysis) on metric parameters. Leven's test for homogeneity of variance has been performed to assess the homogeneity of variance. Student's t-test (two-tailed, dependent) has been used to find the significance of study parameters on continuous scale within each group.
Chi-square/Fisher's exact test has been used to find the significance of study parameters on categorical scale between two or more groups, Nonparametric setting for Qualitative data analysis. Fisher's exact test used when cell samples are very small.
Pearson correlation between study variables is performed to find the degree of relationship, Pearson correlation coefficient ranging between −1 and 1, −1 being the perfect negative correlation, 0 is the no correlation, and 1 means perfect positive correlation
Significant figures
+ - Suggestive significance (P: 0.05 < P < 0.10)
* - Moderately significant (P: 0.01 < P ≤ 0.05)
RESULTS
Of the 100 patients in our study, in our selected time frame, 51% were male and 49% were female. Since our study was in a multidisciplinary ICU, 67% were medical patients and 33% were surgical patients. Of these 29 patients were mechanically ventilated [Tables 1, 2 and Figures 2–5].
Table 1.
Demographic data
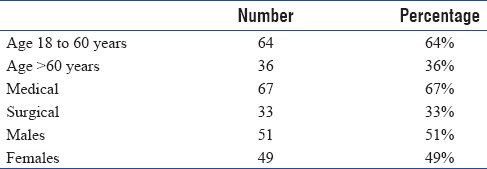
Table 2.
Mechanically ventilated patients

Figure 2.
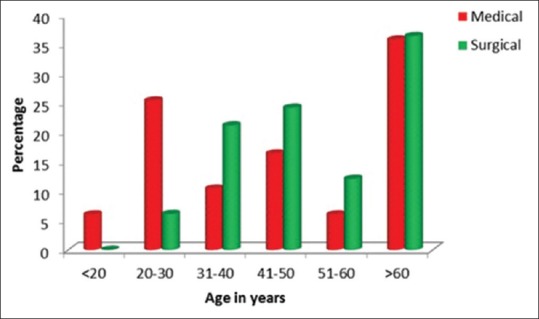
Age in years
Figure 5.
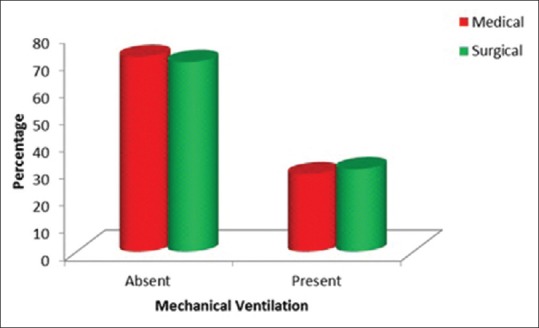
Mechanically ventilated patients
Figure 3.
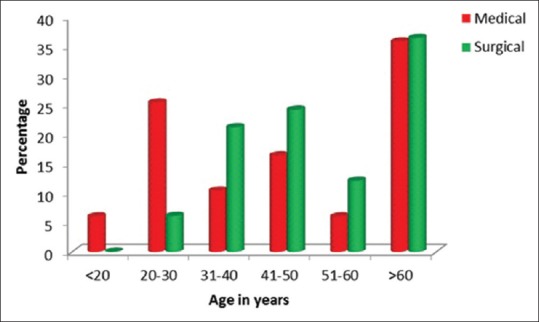
Distribution of medical and surgical cases
Figure 4.
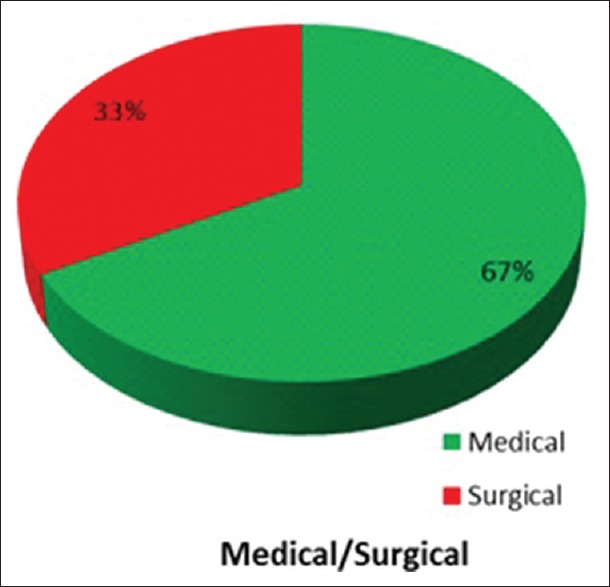
Distribution of males and females
Amongst medical and surgical patients, there was no difference in any of the parameters namely rectus femoris, skin to bone, skin to muscle, and fat thickness [Table 3].
Table 3.
Comparison of the variables on day 1, 3 and 7

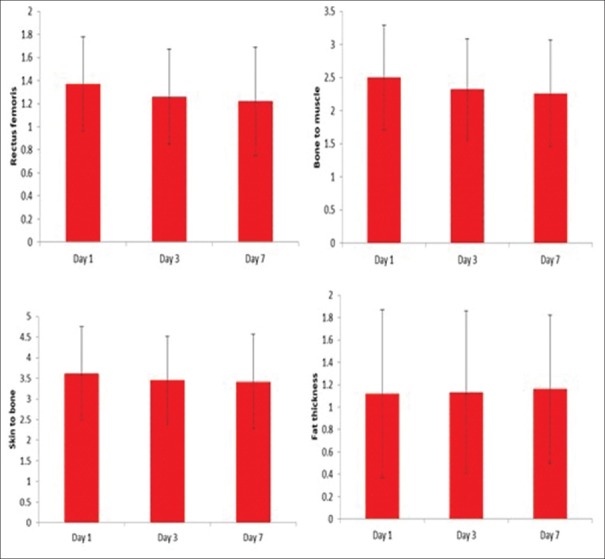
We assessed the study variables on day 1, 3, and 7 and tried to determine if there were any significant changes between day 1 and day 3; day 3 and day 7 among these study variables. We found on day 3 that the rectus femoris thickness was 1.26 ± 0.41 as compared to 1.37 ± 0.41 on day 1 (P < 0.001) [Table 3 and Figures 6–9].
Figure 6.
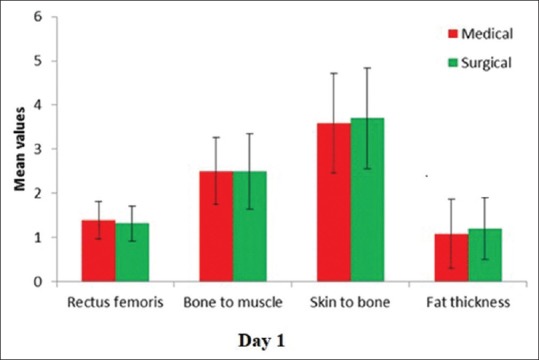
The comparison of the variables on day 1 in medical and surgical patients
Figure 9.
Comparision of individual variables on day 1, 3 and 7
Figure 7.
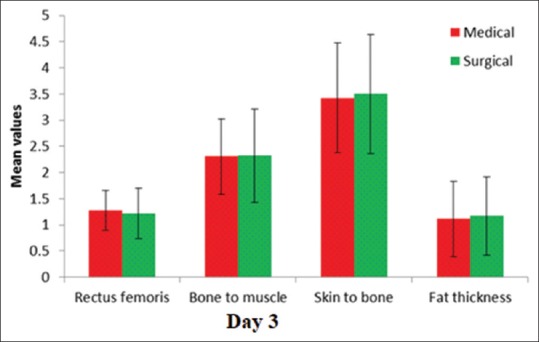
The comparison of the variables on day 3 in medical and surgical patients
Figure 8.
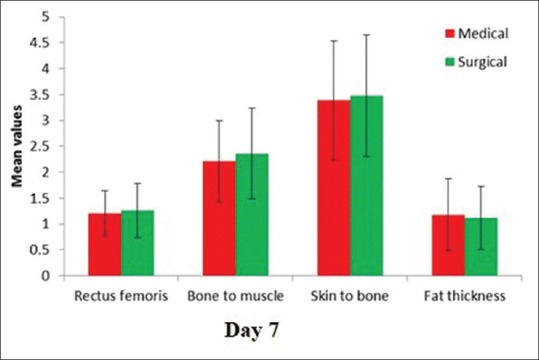
The comparison of the variables on day 7 in medical and surgical patients
On day 7, thickness was 1.22 ± 0.47. This difference was highly significant (P < 0.001). The bone to muscle measurement which reflects the total muscle thickness (rectus femoris and vastus intermedius) showed a similar reduction.
The skin to bone thickness (total muscle and fat thickness) showed a statistically significant reduction (P < 0.001).
The fat thickness which is the difference between skin to bone and bone to muscle thickness showed a slight increase which was statistically not significant. We attribute this to two factors. One was that multifactorial subcutaneous edema in critically ill patients leads to inaccurate measurements of fat. Since muscle layer is not affected by edema, the reduction could be consistently measured and quantified. The second factor being direct measurement of fat layer is not possible accurately with point-of-care ultrasound. To quantify fat accurately, other techniques need to be used.
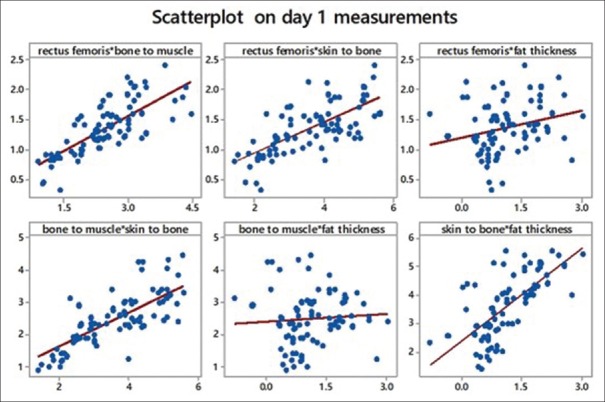
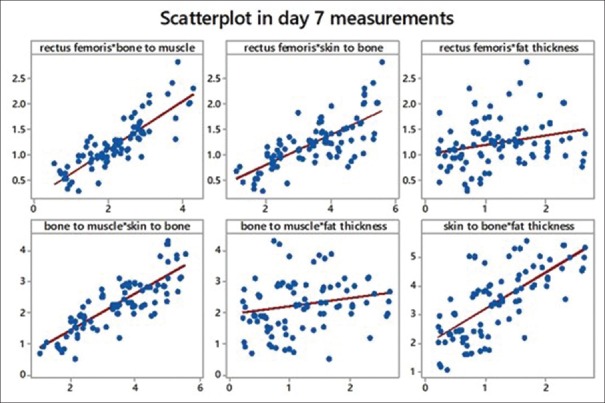
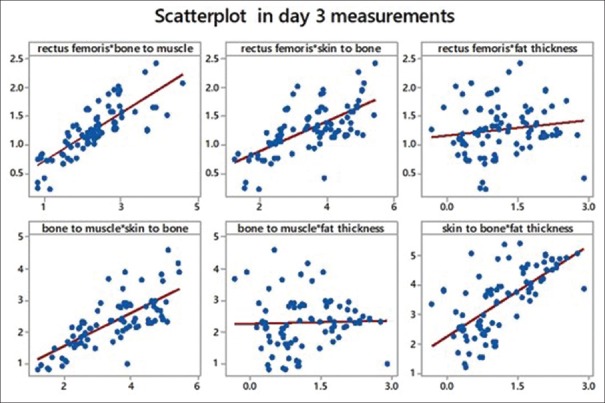
We tried to obtain Pearson's correlation among the study variables. We found a strong correlation between rectus femoris and bone to muscle (which means all muscles are equally affected). We also found a strong correlation between bone to muscle that is total muscle mass and skin to bone thickness, which leads us to conclude that there is considerable fat loss. Another strong correlation found was between skin to bone and fat thickness (a calculated value). Refer scatter diagrams [Table 4 and Figures 10–12].
Table 4.
P value and r value in variables on day 1, 3 and 7

Figure 10.
Scatterplot showing comparison of variables with each other on day 1
Figure 12.
Scatterplot showing comparison of variables with each other on day 7
Figure 11.
Scatterplot showing comparison of variables with each other on day 3
DISCUSSION
In this study, we used ultrasonography for the evaluation of quantitative changes of skeletal muscles in all patients admitted in our multidisciplinary ICU. This study was designed to evaluate if along with the muscle thickness, subcutaneous fat also underwent reduction and if it can be used as an indicator of nutritional assessment in critically ill patients using point of care ultrasound.
Ultrasound has been used to rate the loss of skeletal muscles in patients with orthopedic trauma, chronic obstructive pulmonary disease, cancer, and neuromuscular disorders.[21,22,23]
Several factors are linked to muscle wasting over the course of the critical illness in both the acute and chronic phase: inflammation, neuroendocrine stress response, immobilization, impaired microcirculation and denervation, infections, nutritional deficiency, hyperglycemia, and drugs.[1]
The advantage of ultrasound measurement is that it is less expensive, less time-consuming, safer and has no radiation exposure. Several studies have shown a good intrarater and interrater reliability for ultrasound measurement of muscle thickness in adult critically ill patients. However, to avoid interrater variability, all ultrasound measurements were done by a single person.[5,14]
Quantitative changes of skeletal muscles
Many anatomical landmarks have been used for identification of the point for the assessment of quantitative changes of skeletal muscles. We used the anterior inferior iliac spine and not the anterior superior iliac spine because the line joining the anterior inferior iliac spine to the superior border of patella fell in the midline, which corresponded to the thickest part of the muscle using the insertion points of rectus femoris as reference. This easily gives us access to the rectus femoris and vastus intermedius.
It has been shown that a reduction in rectus femoris cross-sectional area was associated with organ failure. Patients with single-organ failure showed limited wasting whereas those with failure of four organs showed muscle loss of more than 15% by the end of 1 week in a previous study.[5]
A study conducted by Annetta et al. showed that muscle wasting during critical illness could be severe and in excess of what is expected solely with inactivity or systemic illness. Immobilization and inflammation rather than inadequate nutritional support, might be major determinants of loss of muscle. Inactivity is a potent stimulus to muscle protein breakdown. It occurs early and rapidly during the 1st week of critical illness and is more profound among those with multiorgan failure. Increased muscle proteolysis relative to protein synthesis is causative for the development of muscle atrophy. Our study also showed similarity.[16]
A study conducted by Puthucheary et al. showed that 17.7% reduction in rectus femoris cross-sectional area was shown in a group of mixed ICU patients from day 1 to day 10, with the major loss occurring during the first 7 days. In our study, we found similar results.[5]
Fat thickness
During times of illness, there is loss of subcutaneous fat within 24 h due to exhaustion of source of glucose. This stimulates gluconeogenesis. During this process, there is decreased insulin secretion which leads to relative increase in glucagon. This signals the adipocytes to break down into free fatty acids and then ketones. The breakdown of fat as a primary energy source results in ketones to supplying the majority of energy while maximizing muscle preservation. However, the stress response is also characterized by negative nitrogen balance and a more rapid rate of muscle wasting because of accelerated catabolism.[12]
Various investigators, such as Annetta et al., Puthucheary et al., and Guerreiro et al., have used point-of-care ultrasound for muscle wasting to determine the nutritional status of critically ill patients like us. We wanted to extend the measurements to fat thickness also.[24]
We hope our study will help investigators minimize the ICUAW, thereby decreasing comorbities, length of stay thus improving patient care and reducing morbidity.
CONCLUSIONS
Our study demonstrates the potential utility of ultrasound for early detection and probable corrective measures to prevent ICUAW and thus hasten weaning and decrease the ICU length of stay.
The rectus femoris thickness, skin to bone, and bone to muscle thickness show statistically significant difference on day 3, day 7 compared to day 1.
Since fat layer did not decrease as much as the muscle layer, we infer that the cause is unlikely due to under-nutrition.
Hence, we recommend ultrasonography measurement given its bedside applicability, but it is imperative to follow a standardized protocol to reduce variations.
Limitations
The fat thickness was a calculated value
We did not consider confounding factors such as old age, comorbidities, malignancy and long-term use of medications
The first day of ICU admission does not necessarily reflect the first day of critical illness.
Future scope
Imaging modalities have become a new area of research for the nutrition support field, for the impact of nutritional approaches in the critical care setting
Sequential assessment of quantitative and qualitative changes of muscle mass may help identify critically ill patients with high risk of muscle dysfunction.
Financial support and sponsorship
Nil.
Conflicts of interest
There are no conflicts of interest.
Acknowledgment
The authors would like to thank the patients for their co-operation.
REFERENCES
- 1.Fan E, Cheek F, Chlan L, Gosselink R, Hart N, Herridge MS, et al. An official American Thoracic Society Clinical Practice Guideline: The diagnosis of intensive care unit-acquired weakness in adults. Am J Respir Crit Care Med. 2014;190:1437–46. doi: 10.1164/rccm.201411-2011ST. [DOI] [PubMed] [Google Scholar]
- 2.Casaer MP. Muscle weakness and nutrition therapy in ICU. Curr Opin Clin Nutr Metab Care. 2015;18:162–8. doi: 10.1097/MCO.0000000000000150. [DOI] [PubMed] [Google Scholar]
- 3.Bender DV, Krznaric Z, Kunovic A, Rupcic I. Croatian International Symposium on Intensive Care Medicine. Zagreb: Croatia; 2012. Malnutrition in ICU. [Google Scholar]
- 4.Files DC, Sanchez MA, Morris PE. A conceptual framework: The early and late phases of skeletal muscle dysfunction in the acute respiratory distress syndrome. Crit Care. 2015;19:266. doi: 10.1186/s13054-015-0979-5. [DOI] [PMC free article] [PubMed] [Google Scholar]
- 5.Puthucheary ZA, Rawal J, McPhail M, Connolly B, Ratnayake G, Chan P, et al. Acute skeletal muscle wasting in critical illness. JAMA. 2013;310:1591–600. doi: 10.1001/jama.2013.278481. [DOI] [PubMed] [Google Scholar]
- 6.Casaer MP, Wilmer A, Hermans G, Wouters PJ, Mesotten D, Van den Berghe G, et al. Role of disease and macronutrient dose in the randomized controlled EPaNIC trial: A post hoc analysis. Am J Respir Crit Care Med. 2013;187:247–55. doi: 10.1164/rccm.201206-0999OC. [DOI] [PubMed] [Google Scholar]
- 7.De Jonghe B, Bastuji-Garin S, Durand MC, Malissin I, Rodrigues P, Cerf C, et al. Respiratory weakness is associated with limb weakness and delayed weaning in critical illness. Crit Care Med. 2007;35:2007–15. doi: 10.1097/01.ccm.0000281450.01881.d8. [DOI] [PubMed] [Google Scholar]
- 8.Weijs PJ, Looijaard WG, Dekker IM, Stapel SN, Girbes AR, Oudemans-van Straaten HM, et al. Low skeletal muscle area is a risk factor for mortality in mechanically ventilated critically ill patients. Crit Care. 2014;18:R12. doi: 10.1186/cc13189. [DOI] [PMC free article] [PubMed] [Google Scholar]
- 9.Hermans G, Van Mechelen H, Clerckx B, Vanhullebusch T, Mesotten D, Wilmer A, et al. Acute outcomes and 1-year mortality of intensive care unit-acquired weakness. A cohort study and propensity-matched analysis. Am J Respir Crit Care Med. 2014;190:410–20. doi: 10.1164/rccm.201312-2257OC. [DOI] [PubMed] [Google Scholar]
- 10.Gruther W, Benesch T, Zorn C, Paternostro-Sluga T, Quittan M, Fialka-Moser V, et al. Muscle wasting in intensive care patients: Ultrasound observation of the M.quadriceps femoris muscle layer. J Rehabil Med. 2008;40:185–9. doi: 10.2340/16501977-0139. [DOI] [PubMed] [Google Scholar]
- 11.Manning EM, Shenkin A. Nutritional assessment in the critically ill. Crit Care Clin. 1995;11:603–34. [PubMed] [Google Scholar]
- 12.Fischer M, JeVenn A, Hipskind P. Evaluation of muscle and fat loss as diagnostic criteria for malnutrition. Nutr Clin Pract. 2015;30:239–48. doi: 10.1177/0884533615573053. [DOI] [PubMed] [Google Scholar]
- 13.Turton P, Hay R, Taylor J, McPhee J, Welters I. Human limb skeletal muscle wasting and architectural remodeling during five to ten days intubation and ventilation in critical care – An observational study using ultrasound. BMC Anesthesiol. 2016;16:119. doi: 10.1186/s12871-016-0269-z. [DOI] [PMC free article] [PubMed] [Google Scholar]
- 14.Tillquist M, Kutsogiannis DJ, Wischmeyer PE, Kummerlen C, Leung R, Stollery D, et al. Bedside ultrasound is a practical and reliable measurement tool for assessing quadriceps muscle layer thickness. JPEN J Parenter Enteral Nutr. 2014;38:886–90. doi: 10.1177/0148607113501327. [DOI] [PMC free article] [PubMed] [Google Scholar]
- 15.Paris MT, Mourtzakis M, Day A, Leung R, Watharkar S, Kozar R, et al. Validation of bedside ultrasound of muscle layer thickness of the quadriceps in the critically ill patient (VALIDUM study) JPEN J Parenter Enteral Nutr. 2017;41:171–80. doi: 10.1177/0148607116637852. [DOI] [PubMed] [Google Scholar]
- 16.Annetta MG, Pittiruti M, Silvestri D, Grieco DL, Maccaglia A, La Torre MF, et al. Ultrasound assessment of rectus femoris and anterior tibialis muscles in young trauma patients. Ann Intensive Care. 2017;7:104. doi: 10.1186/s13613-017-0326-x. [DOI] [PMC free article] [PubMed] [Google Scholar]
- 17.Rosner B. Cengage Learning. 5th ed. Boston, Massachusetts: Duxbury; 2000. Fundamentals of Biostatistics; pp. 80–240. [Google Scholar]
- 18.Riffenburg RH. Statistics in Medicine. 2nd ed. “Cambridge, Massachusetts: Academic Press; 2005. pp. 85–125. [Google Scholar]
- 19.Sunder Rao PS, Richard J. An Introduction to Biostatistics, a Manual for Students in Health Sciences. 4th ed. New Delhi: Prentice Hall of India; 2006. pp. 86–160. [Google Scholar]
- 20.Suresh K, Chandrashekara S. Sample size estimation and power analysis for clinical research studies. J Hum Reprod Sci. 2012;5:7–13. doi: 10.4103/0974-1208.97779. [DOI] [PMC free article] [PubMed] [Google Scholar] [Retracted]
- 21.Seymour JM, Ward K, Sidhu PS, Puthucheary Z, Steier J, Jolley CJ, et al. Ultrasound measurement of rectus femoris cross-sectional area and the relationship with quadriceps strength in COPD. Thorax. 2009;64:418–23. doi: 10.1136/thx.2008.103986. [DOI] [PubMed] [Google Scholar]
- 22.Campbell SE, Adler R, Sofka CM. Ultrasound of muscle abnormalities. Ultrasound Q. 2005;21:87–94. [PubMed] [Google Scholar]
- 23.Pillen S, Arts IM, Zwarts MJ. Muscle ultrasound in neuromuscular disorders. Muscle Nerve. 2008;37:679–93. doi: 10.1002/mus.21015. [DOI] [PubMed] [Google Scholar]
- 24.Guerreiro AC, Tonelli AC, Orzechowski R, Dalla Corte RR, Moriguchi EH, de Mello RB, et al. Bedside ultrasound of quadriceps to predict rehospitalization and functional decline in hospitalized elders. Front Med (Lausanne) 2017;4:122. doi: 10.3389/fmed.2017.00122. [DOI] [PMC free article] [PubMed] [Google Scholar]


