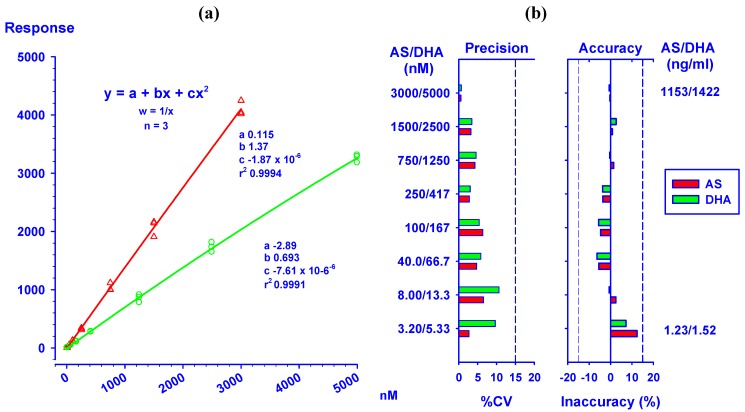
Figure 3.
(a) Linearity test of the standard curves (n = 3) of AS ( )/DHA (
 ) at concentrations ranging from 3.20/5.33 to 3,000/5,000 nM. (b) Precision (%CV) and inaccuracy (%) data from back calculated concentrations of AS/DHA. Dotted lines indicate 15% CV and ±15% inaccuracy levels. Data from triplicate analyses on the same day are shown.

