
Figure 4.
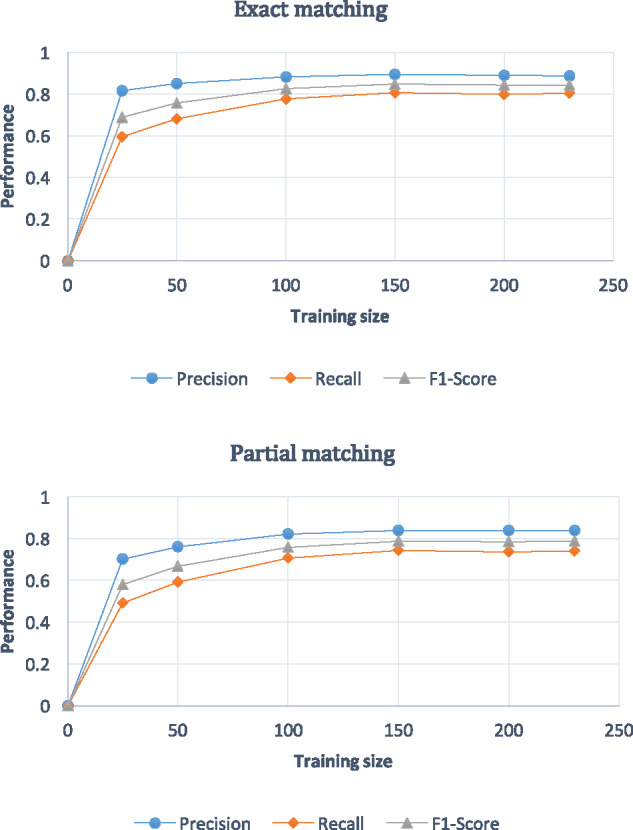
Learning curves for recognition tasks by different sizes of training sizes. The graph on the top describes the learning curves from exact matching evaluation, while the other is partial matching evaluation. Both results show that when the number of the training data is over 150, the performance reaches stable status. In the last version of revision, here the legend F-score should be F1-score.