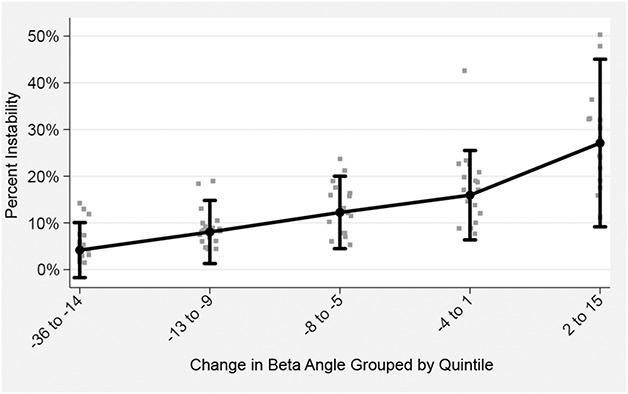
Fig. 4.

This marginal plot was derived from the logistic model by setting the covariates to their means and plotting these in comparison to a categorical variable created for change in β angle by sorting their values into quintiles. Adjusted for age, sex, BMI, and diagnosis.
