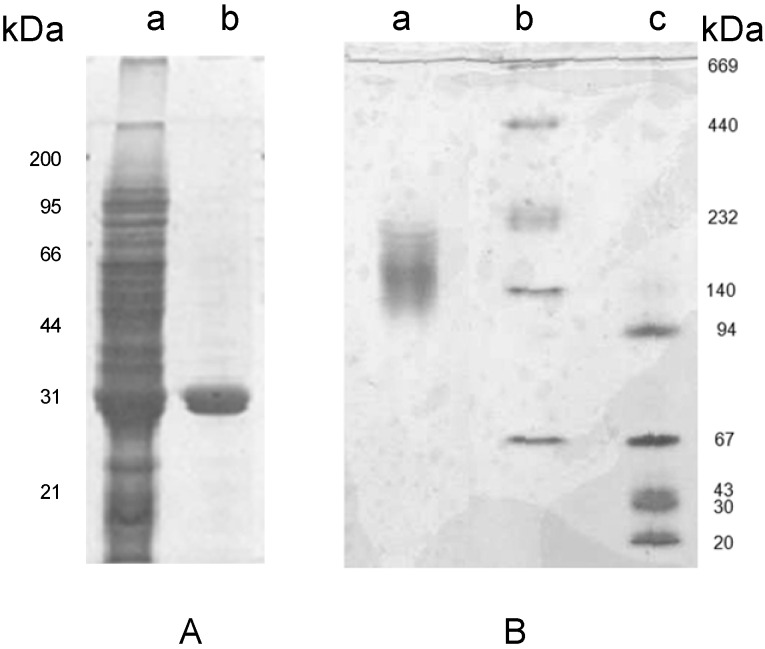
Figure 2.
Electrophoretic analysis of the crude extract and pure lectin fractions from tepary beans on SDS-PAGE (Panel A) and Native PAGE (Panel B). Lane a in Panel A corresponds to the crude extract, lanes b and c corresponds to the pure lectin subunits with a molecular mass of 31 kDa. Panel B, line a shows that the lectin forms oligomers between of 132 and 153 kDa; lines b and c show the native Mw standards.

