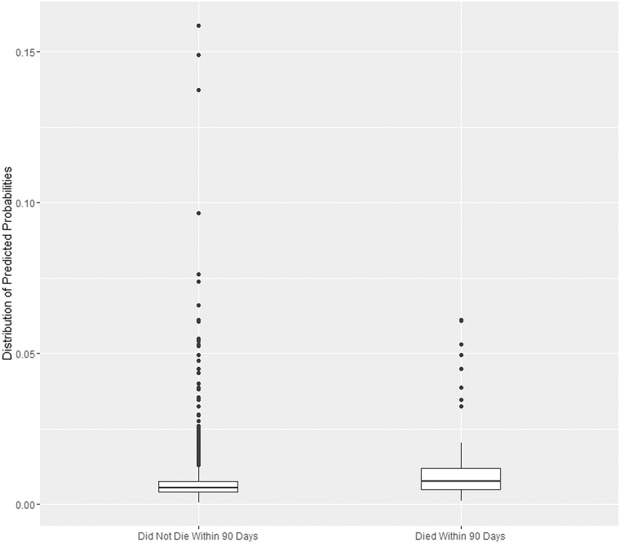
Fig. 1.

The mean of the predicted probability from the calculator is higher for patients who died but also shows substantial overlap in the distributions. The horizontal centerline is the median, the “hinges” (upper and lower limits of the box) represent the first and third quartiles, the whisker extends from the hinge to the largest value no further than 1.5 times the interquartile range from the hinge. Values beyond the whiskers are represented by dots.
