
Figure 5.
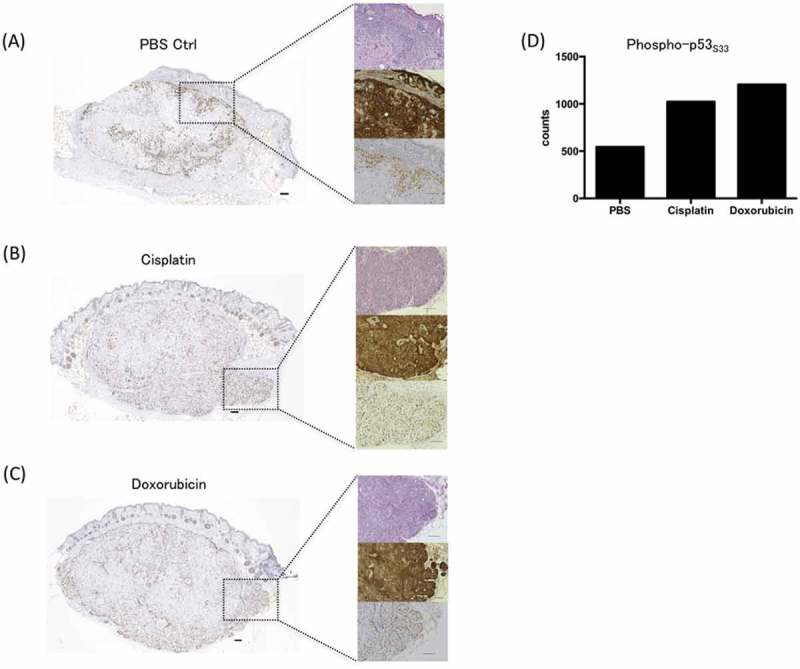
Immunohistochemical analysis of phosphorylated p53 expression in a xenograft model. BALB/c-nu/nu mice were inoculated with HSC4 cells (human HNSCC). PBS (negative control), cisplatin, or doxorubicin treatment was applied when the tumor reached 5 mm. Twenty-four hours after the treatment, mice were sacrificed and the expressions phosphorylated p53 in FFPE tumor samples were examined and representative immunohistochemical images were shown. Phospho-p53S33 expression with PBS (control) (A), cisplatin (B), or doxorubicin treatment (C). Cell counts of phospho-p53S33 positive cells per unit area (mm2) (D). Left boxes: The representative Fig. of the serial-cut section (4-µm thick). Right upper boxes: Hematoxylin-eosin staining. Right middle boxes: cytokeratin 5/6 staining. Right lower boxes: phosphorylated p53 staining. The expression of cytokeratin 5/6 showed that tumor cells consist of SCC. Scale bar is 100 μm.