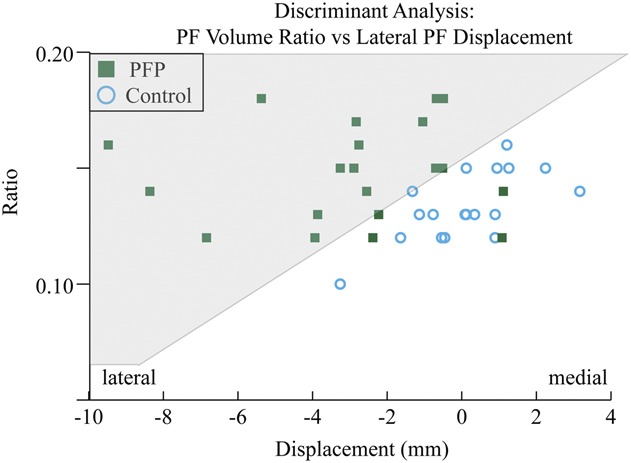
Fig. 5.

Discriminant analysis: the PF volume ratio is plotted relative to the mediolateral displacement. The gray area indicates the region containing individuals with PF pain. Four of our younger control participants were unable to perform the repetitive motion, required for the dynamic acquisition, well enough for us to obtain analyzable data. Thus, for the discriminant analysis, the missing data were replaced by the mean control mediolateral displacement (0.12 mm).
