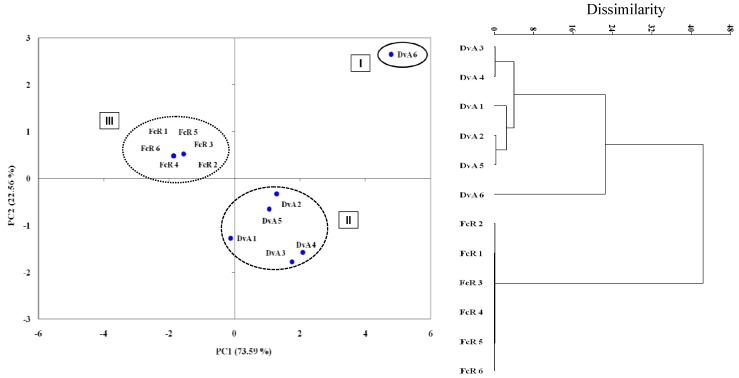
Figure 7.
Classification of plant extracts according to conidia germination of six postharvest fungi by PCA and cluster analysis. The percentage of total variance explained by each axis in PCA is shown. Numbers from 1 to 6, represent the pathogens Aspergillus spp., B. fuckeliana, M. laxa, M. fructigena, P. expansum and P. digitatum, respectively.

