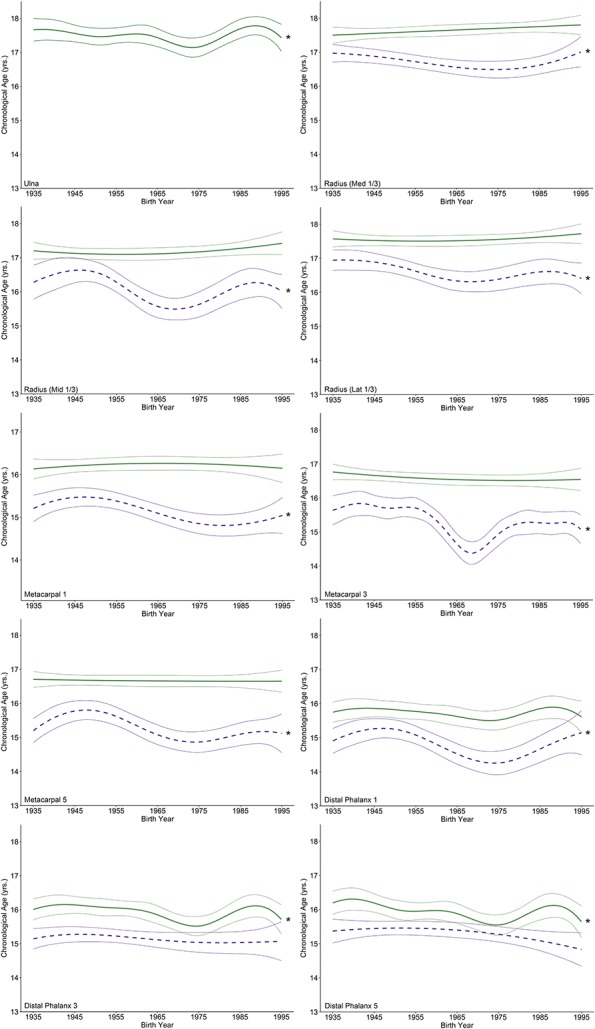
Fig. 2.

These graphs illustrate penalized B-spline curves for EF-I and EF-C traits in the distal ulna and radius as well as the metacarpals and distal phalanges of the first, third, and fifth rays in males born between 1935 and 1995. EF-I is represented by purple-dotted lines and EF-C is represented by green solid lines, each with 95% confidence bands. Models that were statistically significant are denoted by an asterisk.
