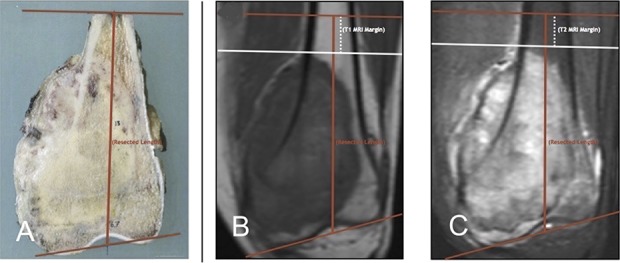
Fig. 1A-C.

(A) The resection length was measured on the catalogued scaled image grid for each specimen. (B) On the corresponding T1 MRI, the diaphyseal extent of the tumor was then marked perpendicular to the anatomic axis of the involved bone (white line). The resection length was then superimposed on the MR image (red line). The “MRI margin” was measured from the diaphyseal extent of the tumor to the diaphyseal resection level. (C) The process described in B was repeated on the corresponding T2 MRI.
