
Fig. 2 A-B.
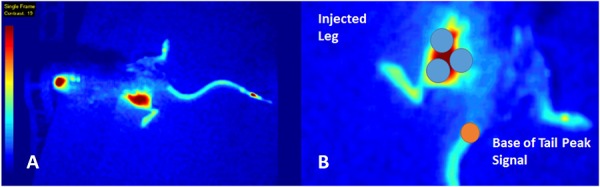
(A) Hindlimb fluorescence shows K7M2 OS cells injected into the left hindlimb of a 4- to 6-week-old female Balb/c mouse. Red represents a high fluorescent signal, whereas blue denotes poor/no signal above the background. (B) Representation of our standardized measurement of primary tumor fluorescence using three independent points on the hindlimb. Normalization for between-animal comparisons was performed by dividing the average hindlimb perfusion with the maximum signal measured on the animal’s tail.