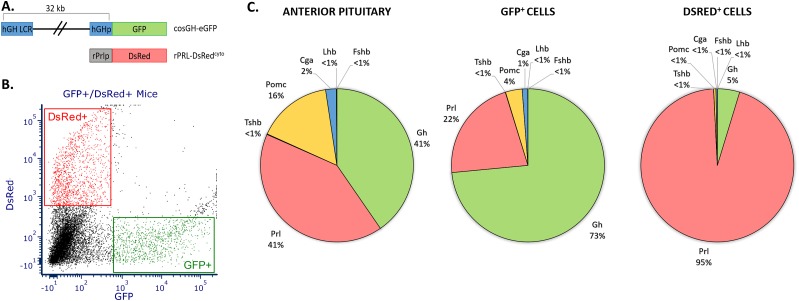
Figure 1.
FACS of primary somatotropes and lactotropes from the mouse pituitary. (A) Schematic of the two transgenes used for selective isolation of somatotropes and lactotropes. (B) Representative FACS of pituitary cells harvested from cosGH-eGFP/rPrl-DsRedcyto compound transgenic mice. The x-axis represents GFP expression and the y-axis represents DsRed expression. Gating used for sorting is represented by rectangles encompassing the sorted populations. (C) Relative expression levels of mRNAs encoding the full array of anterior pituitary hormones in the whole pituitary and from the two FACS populations. Normalized reads (fragments per kilobase of transcript per million mapped reads) are shown for the anterior pituitary hormone genes in total pituitary (left), FACS-sorted GFP+ cells (middle), and FACS-sorted DsRed+ cells (right). All samples used for transcriptomic analyses were generated from 6- to 8-wk-old virgin female mice.

