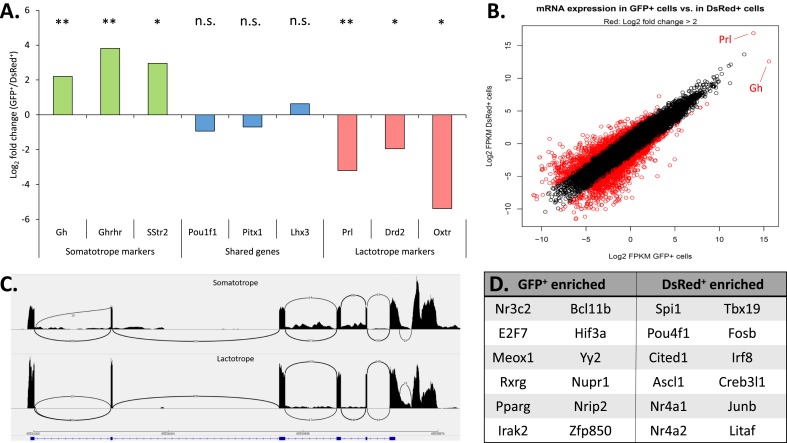
Figure 2.
RNA-seq analysis of flow-sorted GFP+ and DsRed+ cell populations. (A) Enrichment (log2 fold change) of mRNAs in the GFP+ and DsRed+ populations encoding defined markers for somatotropes (green), lactotropes (red), and for markers shared between somatotropes and lactotropes (blue). The designation of each respective marker gene is noted at the bottom of the figure. A positive value on the y-axis indicates enrichment in the GFP+ population whereas a negative value indicates enrichment in the DsRed+ population. Significance values relate to the enrichment in mRNA expression between the two flow sorted populations. *P < 0.05; **P < 0.01. (B) Correlation plot of the RNA-seq analysis of GFP+ cells vs DsRed+ cells. The log2 fragments per kilobase of transcript per million mapped reads values for all mRNAs in the GFP+ (x-axis) and DsRed+ (y-axis) samples were plotted, and mRNAs surpassing a threshold of fourfold enrichment or greater are highlighted in red. These enriched mRNAs were then further filtered to remove low expressers, leaving only genes that were significantly enriched (P ≤ 0.05). The positions of Gh and Prl are noted in this plot. (C) Representative Sashimi plot track showing raw mapped mRNA reads at the Pou1f1 locus in GFP+ and DsRed+ cell populations. The identity of the two Sashimi plots indicates identical splicing patterns of the Pou1f1 transcript in somatotropes and lactotropes. (D) List of transcription factors enriched in GFP+ vs DsRed+ cell populations were identified by taking the GFP/DsRed specific genes identified by differential expression analysis and using PANTHER to identify genes with known gene ontology terms for transcription factor activity. n.s., not significant.

