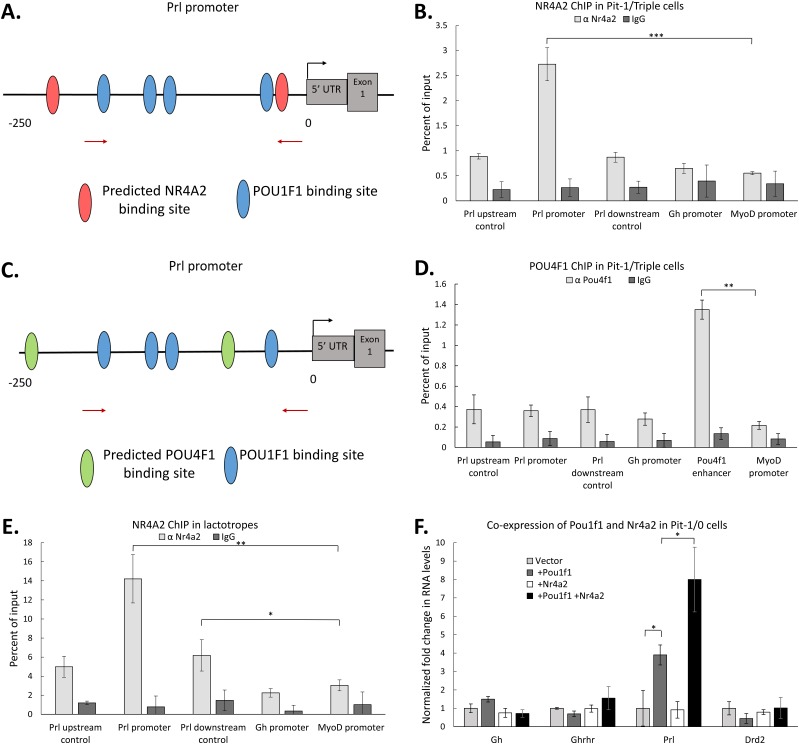
Figure 5.
NR4A2 acts in conjunction with POU1F1 at the Prl promoter to enhance Prl expression. (A) Schematic of the mPrl gene promoter indicating the relative positions of known POU1F1 binding sites [blue ovals (15)] as well as predicted binding sites for NR4A2 (red ovals) (identified by JASPAR). (B) NR4A2 ChIP. Pit-1/Triple cells were transfected with an expression vector encoding NR4A2, and chromatin isolated from GFP+ cells (as in Fig. 4) was assayed by NR4A2 ChIP. Levels of transcription factor occupancy at specific sites within the Prl promoter were quantified by qRT-PCR of immunoprecipitated samples. Parallel controls included quantitation of occupancy at the Gh promoter and assessment of binding in regions 500 bp upstream and downstream of the Prl promoter. The MyoD promoter served as a negative control in all studies. (C) Schematic of the mPrl gene promoter indicating the relative positioning of known POU1F1 binding sites (blue ovals) as well as predicted binding sites for POU4F1 (green ovals) (identified by JASPAR). (D) POU4F1 ChIP. Pit-1/Triple cells were transfected with an expression vector encoding POU4F1 and chromatin isolated from GFP+ cells [as in (B)] was assayed by ChIP. The Pou4f1 enhancer was assayed in this study as a positive control for the POU4F1 ChIP. (E) Nr4a2 ChIP performed in FACS-sorted mouse lactotropes. (F) Impact of NR4A2 on expression of markers genes in Pit-1/0 cells. Pit-1/0 cells were transfected with expression vectors encoding Pou1f1, Nr4a2, or both linked by IRES to GFP, and GFP+ cells were collected by FACS. qRT-PCR analysis was performed to measure changes in mRNA expression of somatotrope and lactotrope marker genes. n = 3 for all experiments. *P < 0.05; **P < 0.01; ***P < 0.001.

