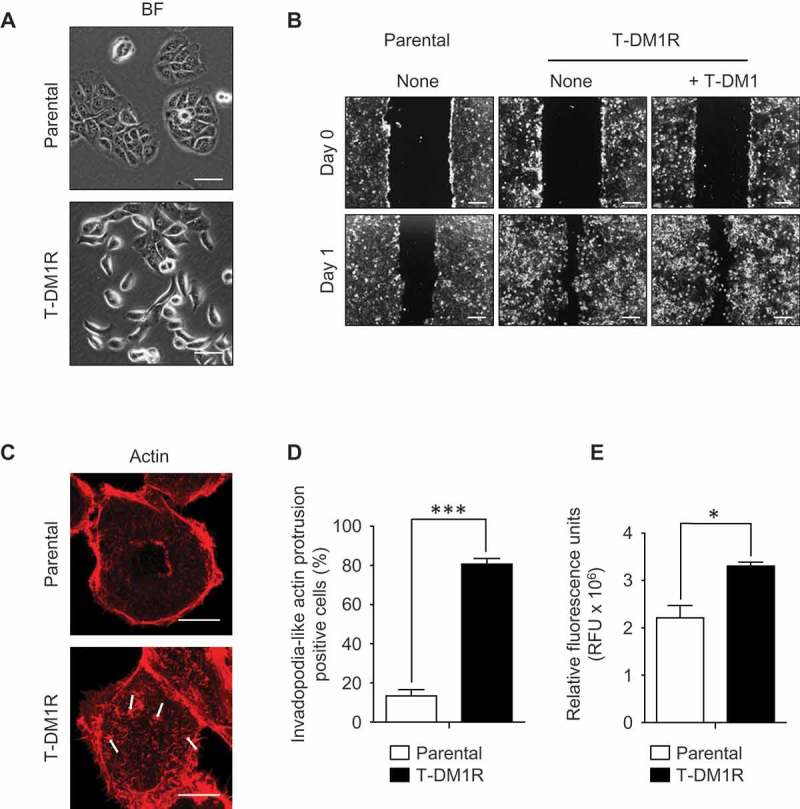
Figure 3.

Cell migration and invasion activities are promoted in T-DM1R cells. (A) Bright field (BF) images of JIMT1 parental and T-DM1R cells. Scale bar, 50 µm. (B) Cell migration assay. Scale bar, 100 µm. BF images of Day 0 and Day 1 are shown for each experiment. (C) Actin staining by rhodamine phalloidin shows invadopodia-like actin protrusion in T-DM1R cells. Scale bar, 10 µm. (D) Quantification of invadopodia-like actin protrusion positive cells in parental and T-DM1R cells. Cell numbers showing invadopodia-like actin protrusion positive cells were quantified per total cell numbers counted in randomly selected fields (n = 3, total 118–370 cells). (E) Cell invasion activity was measured by obtaining relative fluorescence units (RFU) from cells that passively passed through ECM-coated membrane (see Materials & Methods in detail) .
