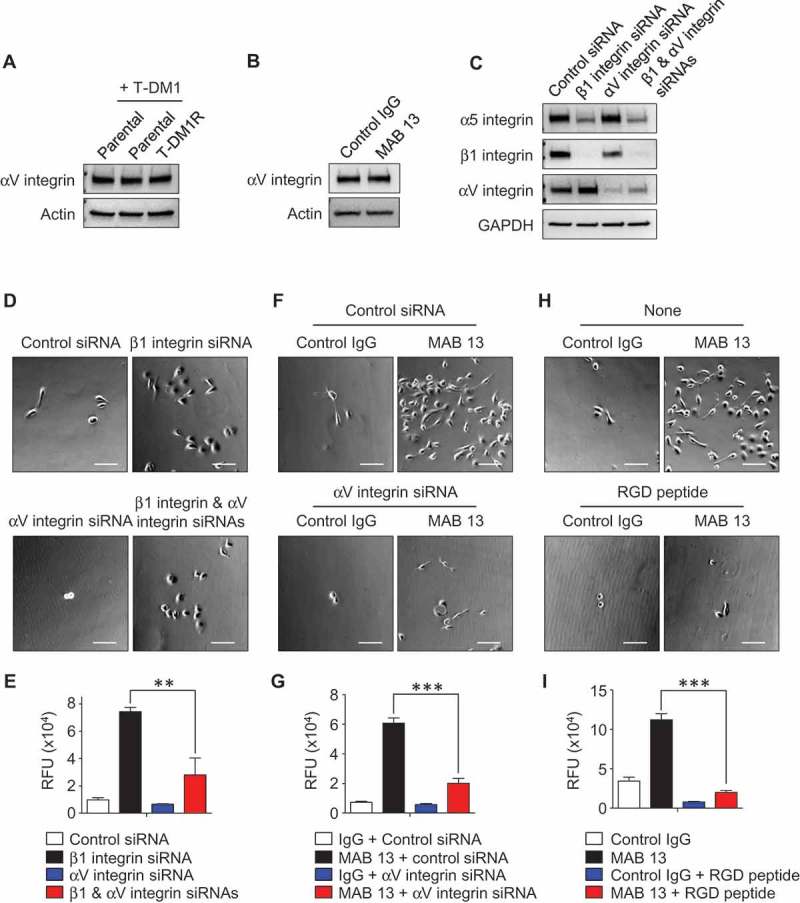
Figure 5.

αV integrin is involved in the enhancement of cell invasion activity in β1 integrin gene knocked-down or function-blocked T-DM1R cells. (A) The levels of αV integrin expression were examined in WCL of parental and T-DM1R cells in the absence/presence of 4 µg/ml T-DM1 by Western blot analysis. (B) The levels of αV integrin expression were examined in WCL of control IgG or MAB 13-treated T-DM1R cells for 48 hrs by Western blot analysis. (C) α5 integrin, β1 integrin and αV integrin protein expressions were evaluated on Western blot analysis after knocking down of β1 integrin, αV integrin or both β1 and αV integrins in T-DM1R cells. (D) Bright field (BF) images showing invasive T-DM1R cells that passed through the ECM-coated membrane. Images represent T-DM1R cells treated with control siRNA, β1 integrin siRNA, αV integrin siRNA, or β1 and αV integrin siRNAs. Scale bar, 100 µm. (E) Quantitative analysis of cell invasion assays. (F) BF images showing invasive T-DM1R cells that passed through the ECM-coated membrane. Images represent T-DM1R cells treated with control IgG + control siRNA, MAB 13 + control siRNA, control IgG + αV integrin siRNA, or MAB 13 + αV integrin siRNAs. Scale bar, 100 µm. (G) Quantitative analysis of cell invasion activity. (H) BF images showing invasive T-DM1R cells that passed through the ECM-coated membrane. Images represent T-DM1R cells treated with control IgG, MAB 13, control IgG + RGD peptide, or MAB 13 + RGD peptide. Scale bar, 100 µm. (I) Quantitative analysis of cell invasion activity.
