
Figure 6.
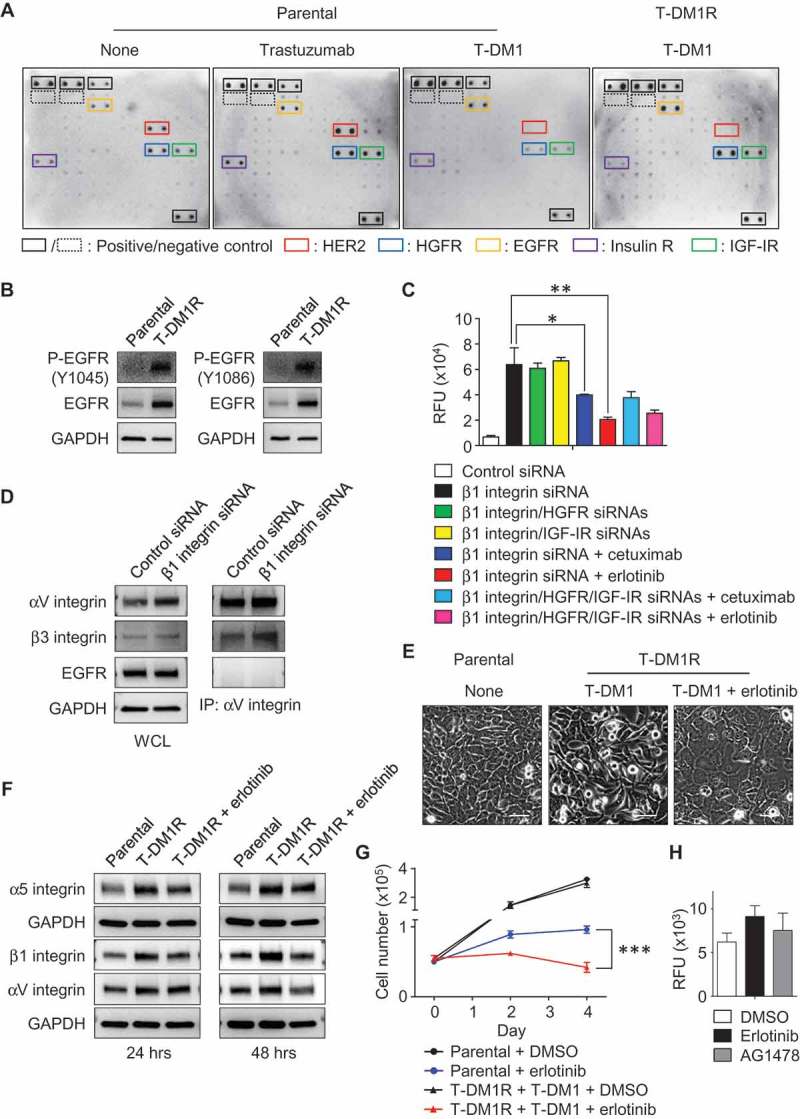
The enhanced EGFR activity functionally cooperates with integrins and regulates T-DM1R cell invasion and growth. (A) Images showing the levels of phosphorylated receptor tyrosine kinases (RTKs) in parental cells treated as indicated or T-DM1R cells. (B) The levels of EGFR and phosphorylated EGFR were evaluated in the WCL of parental and T-DM1R cells by Western blot analysis. (C) Cell invasion activities of T-MD1R cells treated with different specific siRNAs or drugs as indicated. The concentration of cetuximab was 100 µg/ml cetuximab, and concentration of erlotinib was 5 µM. (D) The levels of αV integrin, β3 integrin and EGFR were evaluated in WCL of T-DM1 cells treated with either control siRNA or β1 integrin siRNA using Western blot analysis (left panels). WCL of T-DM1 cells treated as indicated were subjected to co-immunoprecipitation experiments (right panels), and Western blot data showed that β3 integrin, but not EGFR, was detected in anti-αV integrin immunoprecipitates. (E) 1 × 10⁶ JIMT1 parental or T-DM1R cells were seeded on fibronectin-coated 6-well plates and cultured overnight. Then, T-DM1R cells were treated with 5 µM erlotinib or left untreated and cultured for another 24 hrs. Bright field images were captured at 24-hour time point. Scale bar, 50 µm. (F) The levels of α5, β1 and αV integrin expressions were evaluated by Western blot analysis in the WCL collected at 24 and 48-hour time points as shown in E. (G) Cell growth profiles of JIMT1 parental or T-DM1R cells treated with either 5 µM erlotinib or DMSO control, respectively. T-DM1R cells were always cultured in the media containing 4 μg/ml of T-DM1. (H) Cell invasion activities of T-DM1R cells treated with 5 µM erlotinib, 5 µM AG1478 or DMSO control.