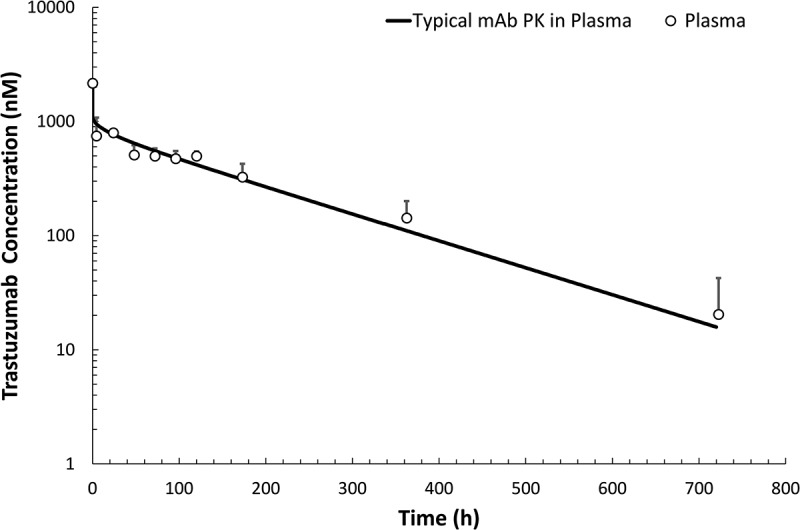
Figure 4.

Trastuzumab pharmacokinetic profile in rat plasma following intravenous administration of 10 mg/kg dose. Plasma samples were collected at 0.083, 4.5, 24, 48, 72, 96, 120, 173, 362, and 722 h after intravenous administration. The solid line represents the typical PK of an antibody in rat plasma simulated using the platform physiologically-based pharmacokinetic model for mAbs.
