
Figure 5.
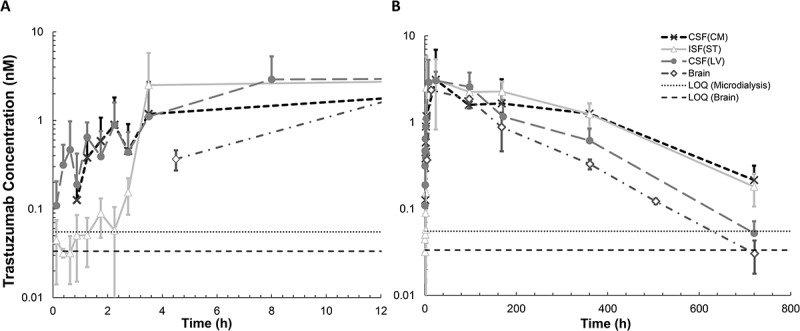
Trastuzumab pharmacokinetic profiles in the striatum, the lateral ventricle, the cisterna magna, and brain homogenate, following intravenous administration of 10 mg/kg dose. (A) The PK of trastuzumab during the initial time points after intravenous administration. Brain microdialysates were collected at 0–15, 15–30, 30–45, 45–60 min, 1–1.5, 1.5–2, 2–2.5, 2.5–3, and 3–4 h after dosing. The y-axis presents the average trastuzumab concentration, and the x-axis presents the mid-time point of each collection period. (B) Trastuzumab PK in rat brain up to 30 days after intravenous administration. Trastuzumab samples were collected at day 0, day 4, day 7, day 15, and day 30. Open triangles represent the interstitial fluid at the striatum; closed circles represent the cerebrospinal fluid within the lateral ventricle; cross marks represent the cerebrospinal fluid within the cisterna magna, and open diamonds represent the brain homogenate. Error bars represent the standard deviation.