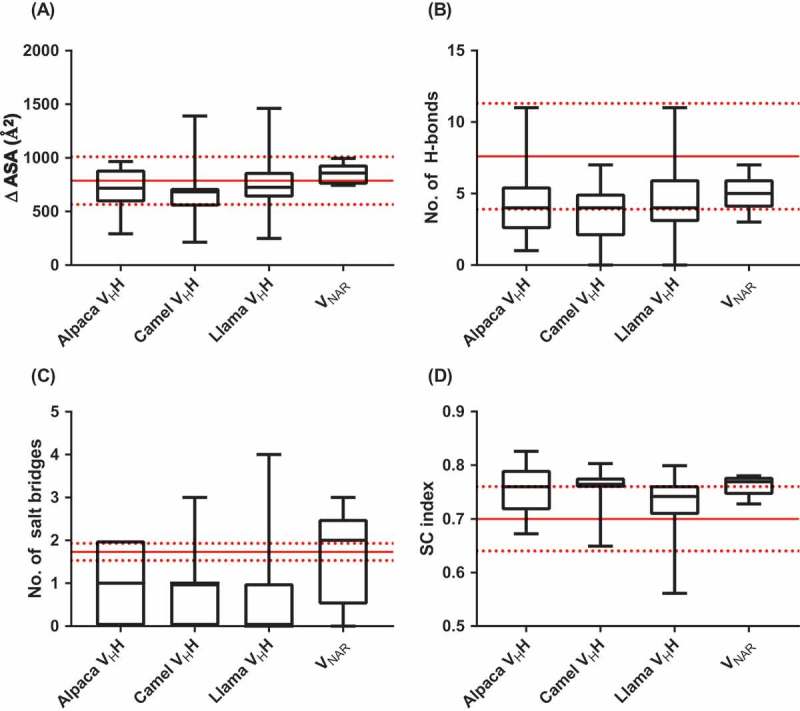
Figure 3.

Properties of sdAb:antigen and conventional antibody:antigen interfaces. (A) Change in solvent-accessible surface area on proteins upon binding by conventional antibodies or sdAbs. (B) Number of hydrogen bonds and (C) number of salt bridges in conventional antibody:antigen and sdAb:antigen interfaces. (D) Shape complementarity index of conventional antibody:protein and sdAb:protein interfaces. Results in parts (A) – (C) were calculated using the PISA server, and in part (D) using the SC algorithm implemented in CCP4. Boxplot lines represent medians, the box boundaries represent quartiles and the box whiskers represent ranges. Red lines indicate the means and standard deviations for conventional antibodies.111,112 Data are representative of all complete antibody:antigen co-crystal structures available in the Protein Data Bank and indexed in PyIgClassify as of January 2018.
