Figure 5.
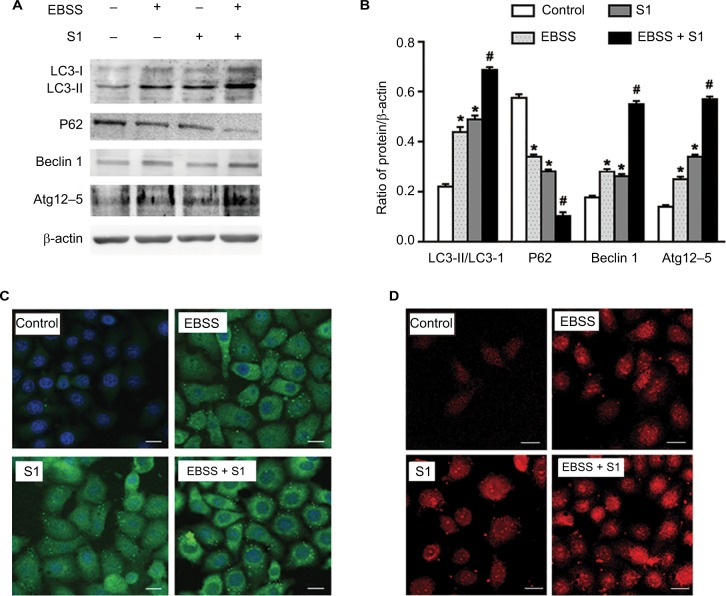
Glucose deprivation enhances the autophagy in HeLa cell induced by S1.
Notes: HeLa cells were treated with 10 µM S1, EBSS, and 10 µM S1 and EBSS for 8 hours. (A) The expression of LC3-II, P62, Beclin 1, and Atg12–5 was determined by Western blot. (B) Quantification of P62 and LC3-II, Beclin 1, and Atg12–5 levels. Data are presented as mean ± SD (n=3). *P<0.05 vs control group. #P<0.01 vs control group. (C) The expression of LC3 was detected by confocal microscopy (bar, 10 µm). (D) Lysosome was observed with LysoTracker staining by confocal microscopy (bar, 10 µm).
Abbreviation: EBSS, Earle’s balanced salt solution.

